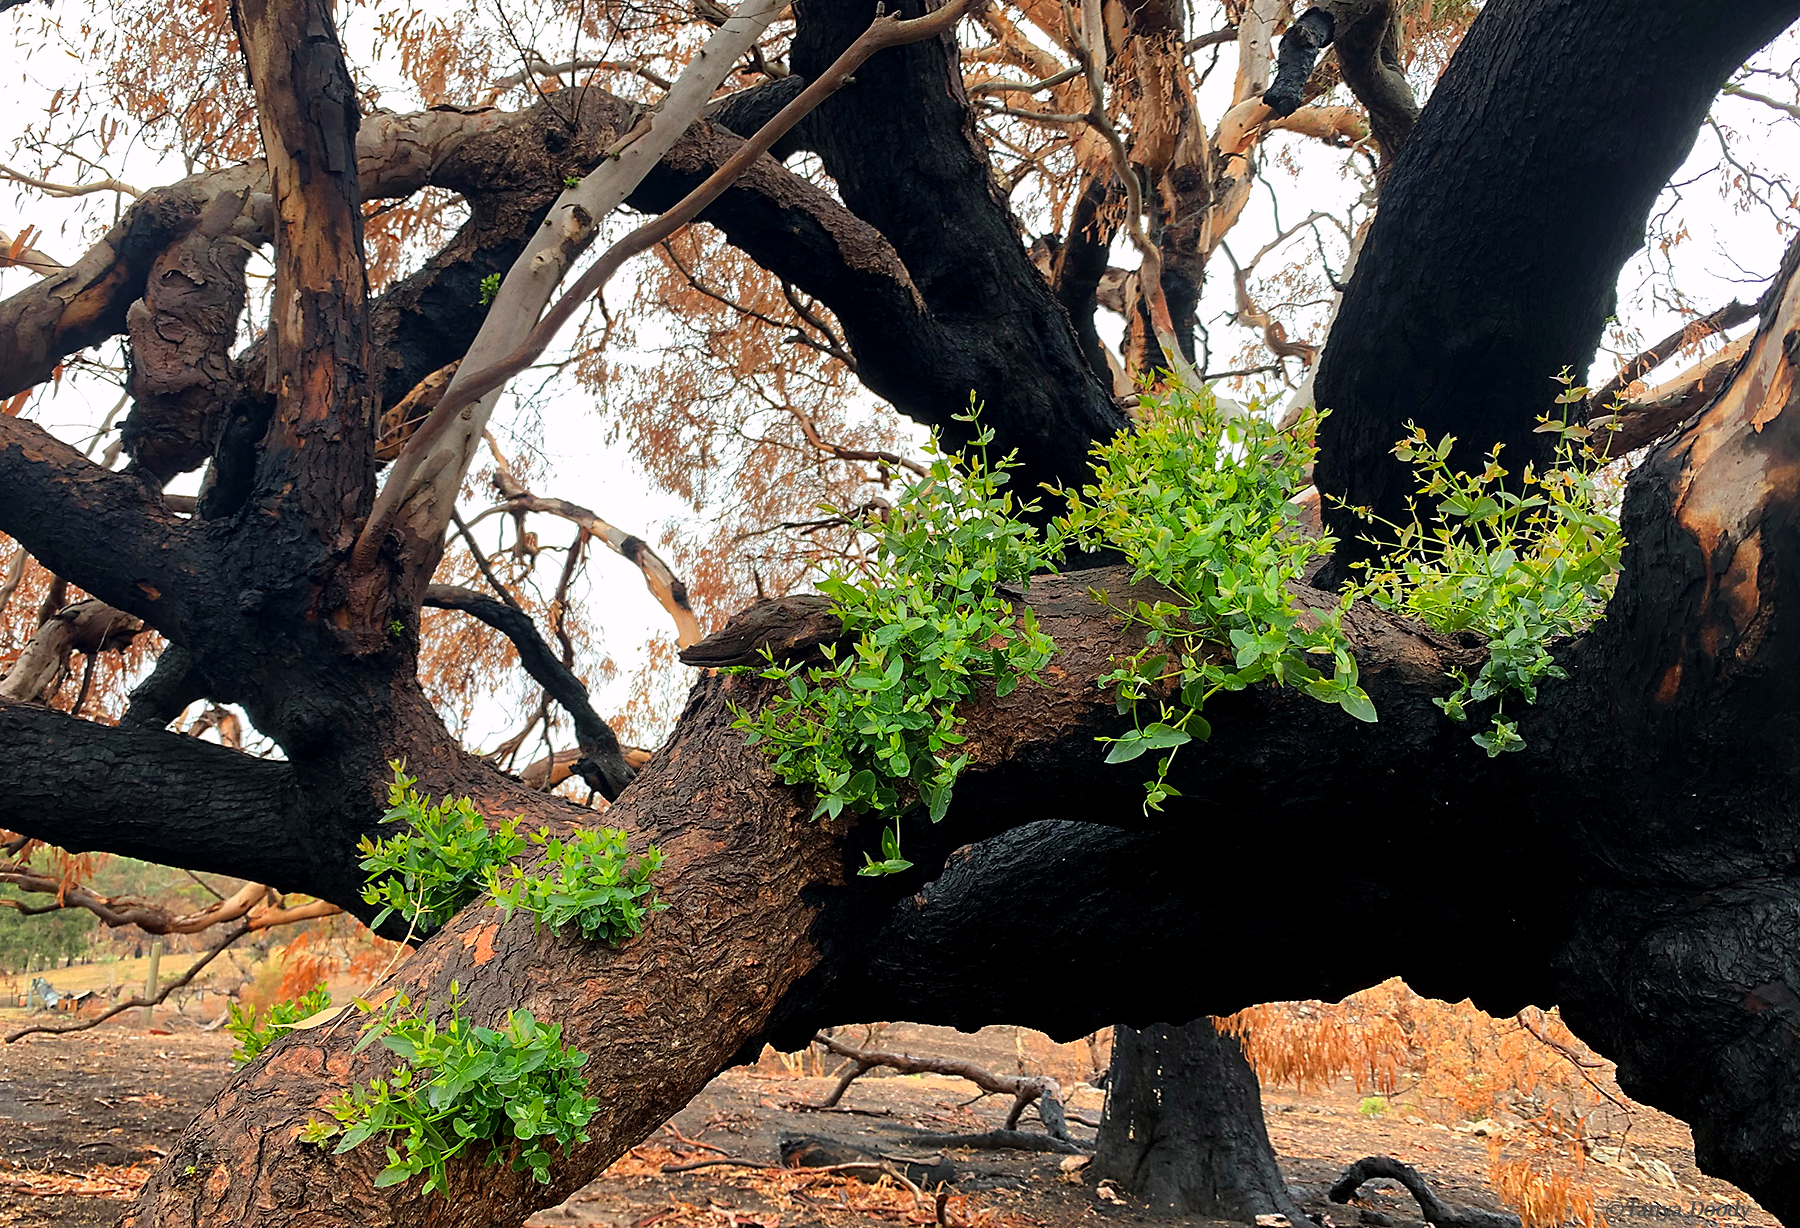
New post fire regrowth in the Adelaide Hills. February 2020. Image credit: Tanya Doody © CSIRO
What a difference a year can make!
At the end of 2019, south eastern Australia was experiencing dust storms and bushfires. Dust storms occur when strong winds blow over areas with low vegetation cover. By the end of 2020, the dust storms had stopped, and the fires had significantly decreased.
Dr John Leys, a visiting scientist with our Land and Water team, said the reduction in dust storm is due to an increase in areas with enough vegetation cover to control wind erosion.
“These are areas with more than 50 per cent vegetation cover,” John said.
Rapping interactive maps
We’re working with the National Landcare Program to produce monthly maps showing total vegetation cover. These are published on the RaPP site. This online tool provides time-series data on the vegetation and environmental conditions in Australia.
The figure below shows total vegetation cover in November 2019 to the left and in November 2020 to the right. The largest change in vegetation cover is on the slopes and plains of New South Wales and along the eastern border of South Australia. Areas with brown tones do not have enough vegetation cover to control wind erosion.
You can explore this RaPP map. Simply click and drag the circular symbol (slider) left or right to see more of the maps.
“In central New South Wales, for example, the area protected from wind erosion has increased from 42 per cent in November 2019 to 98 per cent in November 2020,” John said.
“Good rainfall in the last 12 months increased vegetation cover in November 2020.”
Vegetation and fire
Fire has a huge impact on vegetation cover. RaPP shows this clearly by comparing the months before and after a fire. The map below shows red polygons of indicative fire extent and here’s a detailed description of the map data.
You can further explore this map. Click and drag the circular symbol (slider) left or right to see more of the maps. Move the slider left to right to see the difference in the vegetation cover in the fire regions between February and November 2020.

Changing the month while looking at the fire area indicates when it was burnt. The colour changes from blue (high cover of more than 80 per cent) to white (moderate cover of about 50 per cent) post fire.
“For example, the area west of Coffs Harbour has low cover in September 2019. Further north the cover decreases in December 2019,” John said.
“Recovery of the vegetation cover can be seen in many areas by November 2020. However, high vegetation cover does not indicate the forest has fully recovered to pre-fire condition. It just means there are plants covering the ground.”

23rd January 2021 at 7:17 am
Great article. I like this kind of interactivity, especially when based on environmental concern.
Here in Brazil where I am, a similar thing should be very important. However, unfortunately, our actual president and the ministry of environment don’t care much about the trees, vegetation etc, and even, don’t believe that people are cutting the trees and destroying the forest for mining or cattle raising. They even don’t believe in the satellite images showing all these… It’s a shame indeed….
22nd January 2021 at 5:45 pm
I think the more light shed on these subjects the better. I am associated with an 8 hectare rocky urban park which is occasionally control burned in Canberra. It is between rows of houses and the fire threat to them is a major issue! Hughes Garran Woodland.
16th January 2021 at 3:22 am
From the above mapping using the 2019 bushfire burnt areas as ZERO ground fuel areas then perhaps an annual overview of the vegetation growth pattern it may be possible to calculate the ground fuel debris build up rate. This in turn could offer a rule of thumb for a predictive fire intensity on given weather days for fire authorities and assist in planning and initiating sectorial hazard reduction operations.
15th January 2021 at 8:18 pm
Curious how this is being composed; is it using Landsat or Sentinel for remote sensing? Just using the NDVI to measure levels of vegetation?
19th February 2021 at 3:42 pm
Hi Elyse, thanks for your question. The satellite we are mainly using for this work is MODIS (Moderate Resolution Imaging Spectroradiometer). We can also use Landsat or Sentinel depending on the project need.
The methods used derive proportion of the green (NDVI), dead or senescent vegetation and bare ground in each pixel. See: https://www.environment.nsw.gov.au/-/media/OEH/Corporate-Site/Documents/Land-and-soil/setting-targets-monitoring-vegetation-cover-190674.pdf for a more detailed explanation.
Thanks,
Team CSIRO