With the first World Cup match just over (Brazil beat Croatia 3-1) and a month of games to go, no doubt we’ll see soccer crowds in stadiums across Brazil erupting into a Mexican Wave.

Crowd at sports game doing the Mexican wave.
Getting into the spirit of the match.
Back home, our robotics researchers are waving their arms around too, but for a different reason. They’re using new handheld 3D heat mapping technology.
We’ve all heard of energy audits. Maybe you’ve even had one done to find out where your home is losing heat and how you can better conserve energy. Accurate measurements of temperatures and their precise locations is key to that. It’s now easier, cheaper and more reliable thanks to HeatWave, a new 3D handheld thermal imaging system we’ve been working on. We’re pleased that last night it was the winner of the R&D category at the Queensland iAwards, the IT industry awards.
Thermal imaging systems have been around for decades. But they’ve been a bit cumbersome and often only display results in 2D (which for some applications is fine). Not just that, they’ve needed experts to interpret the results. This often involves mentally challenging tasks like comparing and interpreting different kinds of images from different angles. That’s called ‘cognitive load’ in case you need to know.
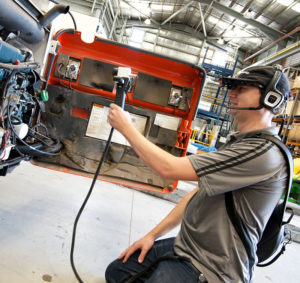
Heatwave scanner being held by operator to scan heat in engine
HeatWave being used to scan the heat in a Bobcat engine
Our system needs less brain and more brawn. Basically if you can wave your arm, you can use HeatWave. It weighs around half a kilo and captures multiple perspectives of the same object, then merges them. It’s built on the SLAM (simultaneous localisation and mapping) technology that makes our famous Zebedee scanner work. But it adds information beyond just the 3D shape – it overlays accurate temperature measurements into a single view using some software smarts we’ve developed. Here’s how it maps a hot engine.
We’re hoping the $4B thermal imaging industry will benefit from HeatWave’s ease of use, precision, portability and reliability. Already we’ve done pilot trials for detecting faults in engines, auditing heat loss in buildings, monitoring the condition of livestock and even people!
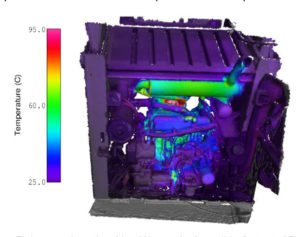
Bobcat engine 3D heat map generated by HeatWave.
So hot right now. Rainbow colours in the 3D heat map show the temperature of specific engine parts.
In the spirit of practicing what we preach, we’ve tried it out on ourselves. One of our researchers had his sore back scanned using HeatWave. The results clearly show where the hot spots (ie painful spots) are in his right shoulder. Hopefully, with a bit of physio, he’ll be waving his arms around pain free sometime soon.
Maybe even doing a Mexican Wave in front of the telly…
