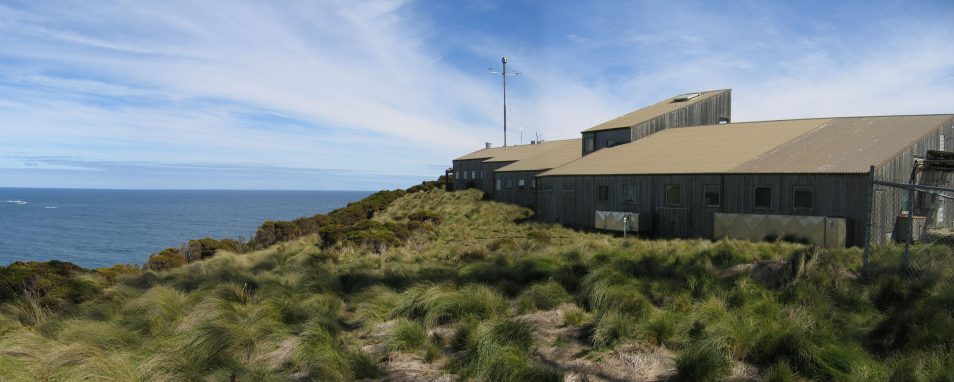
The Cape Grim observatory, home of the ‘world’s cleanest air’… and rising greenhouse gases. Author provided
This week brought news that atmospheric carbon dioxide (CO₂) levels at the Mauna Loa atmospheric observatory in Hawaii have risen steeply for the seventh year in a row, reaching a May 2019 average of 414.7 parts per million (ppm).
It was the highest monthly average in 61 years of measurements at that observatory, and comes five years after CO₂ concentrations first breached the 400ppm milestone.
But in truth, the amount of greenhouse gas in our atmosphere is higher still. If we factor in the presence of other greenhouse gases besides carbon dioxide, we find that the world has already ticked past yet another milestone: 500ppm of what we call “CO₂-equivalent”, or CO₂-e.
In July 2018, the combination of long-lived greenhouse gases measured in the “cleanest air in the world” at Cape Grim Baseline Atmospheric Pollution Station surpassed 500ppm CO₂-e.
As the atmosphere of the Southern Hemisphere contains less pollution than the north, this means the global average atmospheric concentration of greenhouse gases is now well above this level.
What is CO₂-e?
Although CO₂ is the most abundant greenhouse gas, dozens of other gases – including methane (CH₄), nitrous oxide (N₂O) and the synthetic greenhouse gases – also trap heat. Many of them are more powerful greenhouse gases than CO₂, and some linger for longer in the atmosphere. That means they have a significant influence on how much the planet is warming.
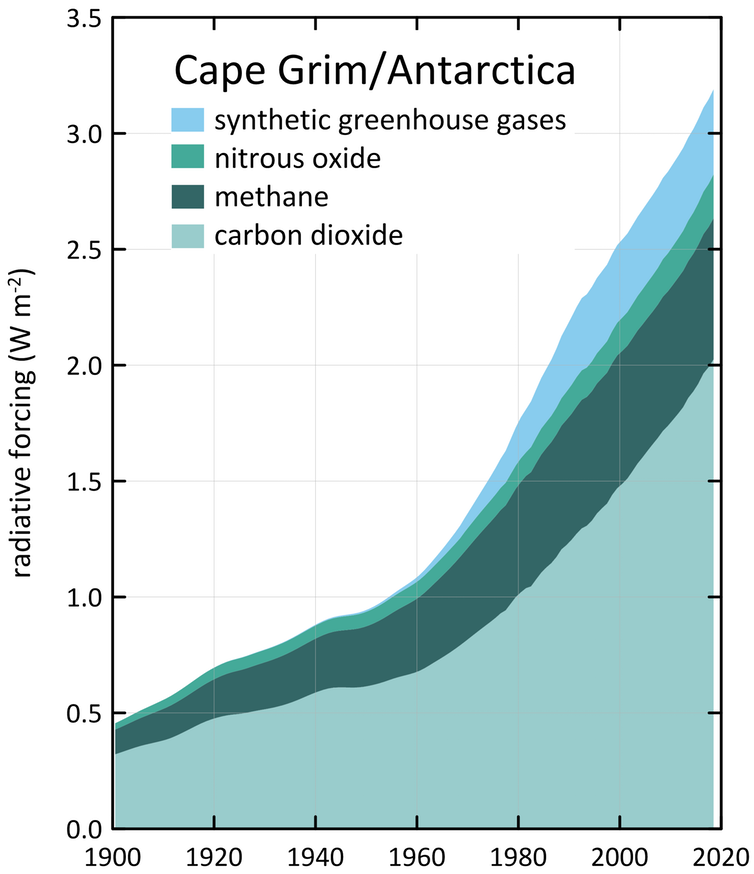
Southern Hemispheric radiative forcing relative to 1750 due to the long-lived greenhouse gases (carbon dioxide, methane, nitrous oxide and synthetic greenhouse gases), expressed as watts per square metre, from measurements in situ at Cape Grim, from the Cape Grim Air Archive, and Antarctic firn air.
Atmospheric scientists use CO₂-e as a convenient way to aggregate the effect of all the long-lived greenhouse gases.
As all the major greenhouse gases (CO₂, CH₄ and N₂O) are rising in concentration, so too is CO₂-e. It has climbed at an average rate of 3.3ppm per year during this decade – faster than at any time in history. And it is showing no sign of slowing.
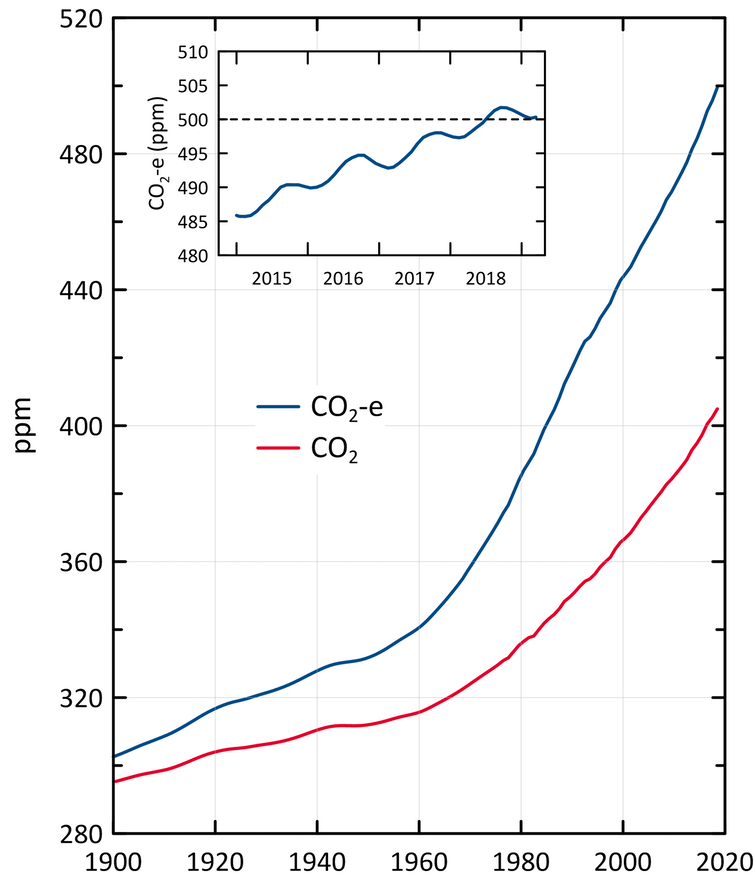
Cape Grim/Antarctic carbon dioxide equivalent (CO₂-e) calculated from the long-lived greenhouse gas radiative forcing data shown in the figure above with CO₂ data shown for reference, annual data through to 2018. Inset panel shows the monthly mean CO₂-e data for Cape Grim from 2015 through to March 2019, showing CO₂-e surpassing 500ppm in July 2018.
This milestone, like so many others, is symbolic. The difference between 499 and 500ppm CO₂-e is marginal in terms of the fate of the climate and the life it sustains. But the fact that the cleanest air on the planet has now breached this threshold should elicit deep concern.
Warming on the way
The Paris climate agreement is aimed at limiting global warming to less than 2℃ above pre-industrial levels, to avoid the most dangerous effects of climate change. But the task of predicting how human greenhouse emissions will perturb the climate system on a scale of decades to centuries is complex.
The best estimate of long-term global warming expected from 500ppm CO₂-e is about 2.5℃. But so far, since pre-industrial times, the global climate (including oceans) has warmed by only 0.7℃.
This is partly because industrial smog and other tiny particles (together called aerosols) reflect sunlight out to space, offsetting some of the expected warming. What’s more, the climate system responds slowly to rising atmospheric greenhouse gas concentrations because much of the excess heat is taken up by the oceans.
The amount of heat each greenhouse gas can trap depends on its absorption spectrum – how strongly it can absorb energy at different wavelengths, particularly in the infrared range. Despite its simple molecular structure, there is still much to learn about the heat-absorbing properties of methane, the second-biggest component of CO₂-e.
Studies published in 2016 and 2018 led to the estimate of methane’s warming potential being revised upwards by 15%, meaning methane is now considered to be 32 times more efficient at trapping heat in the atmosphere than CO₂, on a per-molecule basis over a 100-year time span.
Considering this new evidence, we calculate that greenhouse gas concentrations at Cape Grim crossed the 500ppm CO₂-e threshold in July 2018.
This is higher than the official estimate based on the previous formulation for calculating CO₂-e, which remains in widespread use. For instance, the US National Oceanic and Atmospheric Administration is reporting 2018 CO₂-e as 496ppm.
The graph below shows the two curves for the time evolution of CO₂-e in the atmosphere as measured at Cape Grim, using the old and new formulae.
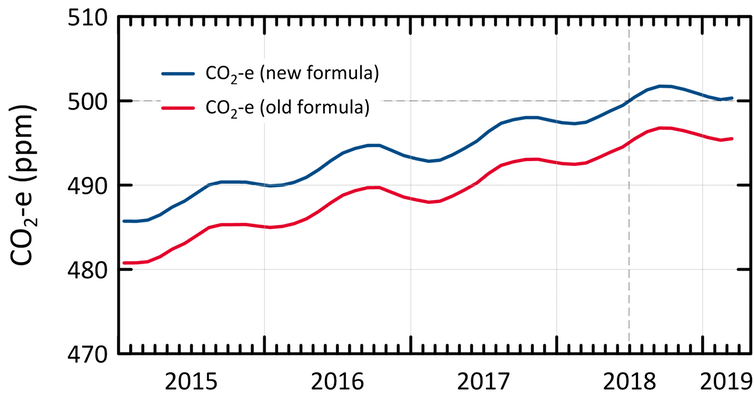
Cape Grim monthly CO2-e from 2015 until Sept 2018 calculated using the old and new formulae.
Some greenhouse gases, such as chlorofluorocarbons (CFCs), also deplete the ozone layer. CFCs are in decline thanks to the Montreal Protocol, which bans the production and use of these chemicals, despite reports that indicate some recent production of CFC-11 in China.
But unfortunately, their ozone-safe replacements, hydrofluorocarbons (HFCs), are very potent greenhouse gases and are on the rise. The recently enacted Kigali Amendment to the protocol means that consumption controls on HFCs are now in place, and this will see the growth rate of HFCs slow significantly and then reverse in the coming decades.
We can change
Australia is at the forefront of initiating measures to curb the impact of HFCs on climate change.
Methane is another low-hanging fruit for climate action, while we undertake the slower and more difficult transition away from CO₂-emitting energy sources.
The significant human methane emissions from leaks in reticulated gas systems, landfills, waste water treatment, and fugitive emissions from coal mining and oil and gas production can be monitored and reduced. We have the science and technology to do this now.
Both in the oil and gas sectors and in urban areas, there are many examples of how methane “hot spots” can be identified and tackled.
It’s a classic win-win that saves money and reduces climate change, and something we should be implementing in Australia in the near future.![]()
Zoe Loh, Research Scientist, CSIRO; Blagoj Mitrevski, Research scientist, CSIRO; David Etheridge, Principal Research Scientist, CSIRO; Nada Derek, Research Projects Officer, Oceans and Atmosphere, Climate Science Centre, CSIRO; Paul Fraser, Honorary Fellow, CSIRO; Paul Krummel, Research Group Leader, CSIRO; Paul Steele, Honorary Fellow, CSIRO; Ray Langenfelds, Scientist at CSIRO Atmospheric Research, CSIRO, and Sam Cleland, Officer in Charge, Cape Grim Baseline Air Pollution Station, Australian Bureau of Meteorology
This article is republished from The Conversation under a Creative Commons license. Read the original article.

27th July 2019 at 10:16 pm
I contacted CSIRO and asked them where I could get data about desert temperatures at night, especially during the last 50 years (the period of most concern) where one would expect to see the greatest increase in greenhouse gas effect by carbon dioxide in the virtual absence of water. I was informed that they did not know about any such data being collected. So we are being giving warnings about the dire threat of the greenhouse gas effect by increasing carbon dioxide levels and our children are being scared out of their wits when there is no evidence that the total carbon dioxide in the atmosphere is having any extra warming effect, never mind our contribution to it.
8th July 2019 at 4:52 pm
Nardoo 123: Actually, the oceans are very well buffered via carbonate/bicarbonate. It would take double the amount of Mankind up to now to drop pH by only 0.1.
And dissolution of calcium carbonate in shells is not possible because the oceans are greatly super-saturated with it.
It pays to do the calculations, although they can be tricky if one hasn’t done First Year Uni Chemistry.
[I’ve done the calculations in Chapter 5 at my site Planet Earth Climate Topics, pjcarson2015.wordpress.com]
8th July 2019 at 4:32 pm
The use of the term “Greenhouse Gas” is dishonest. The gas inside a real horticultural greenhouse is air – the same as that outside, with the same amount of nitrogen, carbon dioxide, etc. The inside becomes warmer because the warmth from the sun is trapped by the walls and roof – and clearly not by the air’s composition.
The recent definition, proclaimed by the IPCC, is that a greenhouse gas can only be one that absorbs IR, such as CO2, CH4 – and musn’t forget H2O – is clearly wrong. Despite some gases being unable to absorb IR – one method of transmitting heat energy – all gases absorb heat one way or another, eg conduction, convection, as illustrated by real greenhouses.