
Have you ever stopped to think about what’s under your feet, under our roads and under the wheat crops that produced the flour in your bread?
Soil features in every continent on the globe; it’s one of the fundamental building blocks of life. It’s pretty important stuff but we don’t often think about it.
But now, we’ve led a team of world experts digging deep, uncovering the secrets of soil and they’ve created the most comprehensive nation-wide digital map of Australia’s soils and landscapes. We worked with TERN (the Terrestrial Ecosystem Research Network), the University of Sydney and a number of state and federal government agencies.
And now, we present to you the Soil and Landscape Grid of Australia.
Using 3-dimensional spatial modelling, and combining rich historical data with new digital information gathered through technology like satellites and sensors in the laboratory, Australia’s best soil and landscape scientists have created new information and a very powerful tool.
The Grid itself is a marvel, representing the whole country as approximately 2 billion data pixels. That means each pixel is the snapshot of an area roughly the size of a football field (90 x 90 metres). Every one of them contains information about the properties of the soil like pH, organic carbon and water capacity, down to a depth of 2 metres, and estimates of uncertainty (we couldn’t go out and sample the entire continent!). The Grid also contains details about the landscape, such as solar radiation and slope.
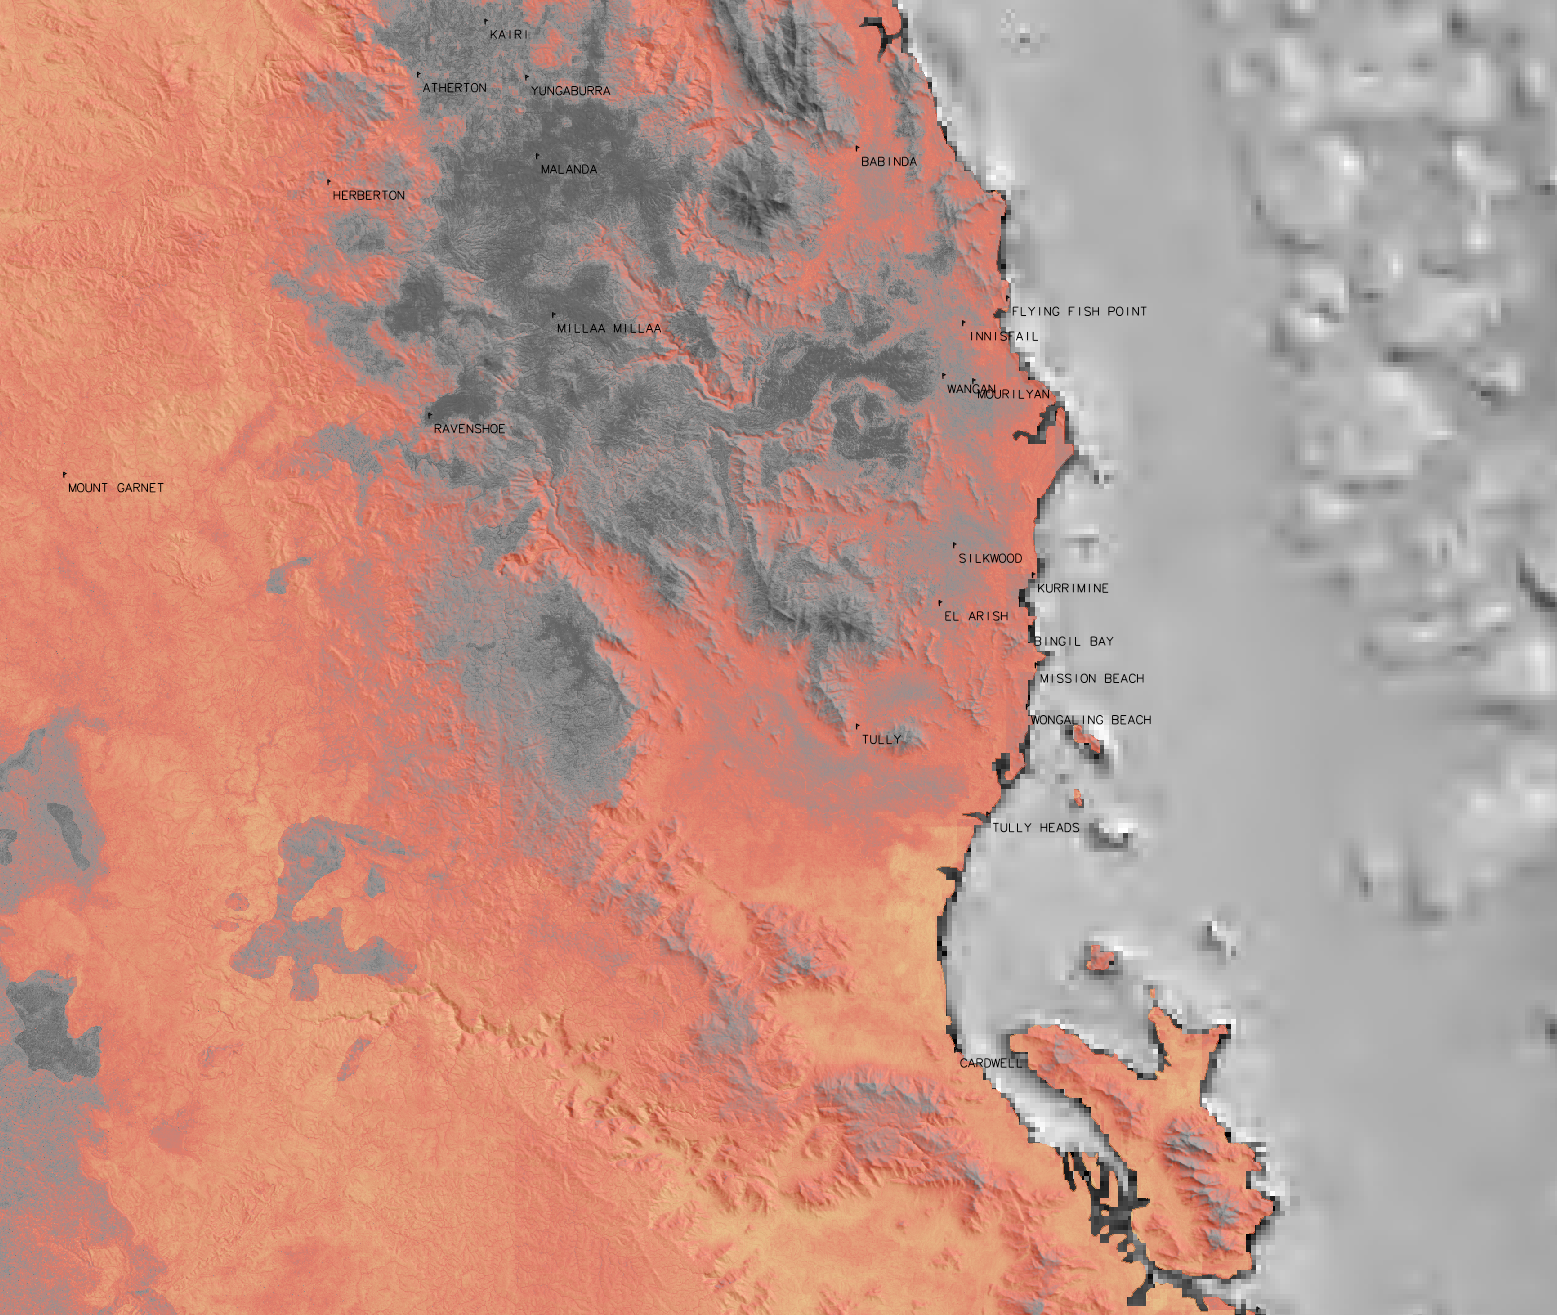
Red clay country in 3D
Not excited about the wonders of dirt? Then what about the science? The Grid uses exciting new infrared spectral methods to derive soil information rapidly and cheaply. It uses advanced spatial modelling that combines earth observation and satellite data to characterise and map the soil across the country. And the technology? The Grid uses powerful computing clusters for computation for the modelling and to produce the maps. It uses smart computing to access the databases from state and territory departments, the University of Sydney and Geoscience Australia. During early user testing one person said, ‘Wow! I can get data in six minutes now instead of six months’. Before the Grid came along he would have had to gather the information from each of the different data systems. It wasn’t quite going door to door, but you get the picture.
Still not excited? How about some nifty data visualisation? The data can be viewed in a few different ways, for example, downloading it into Google Earth.
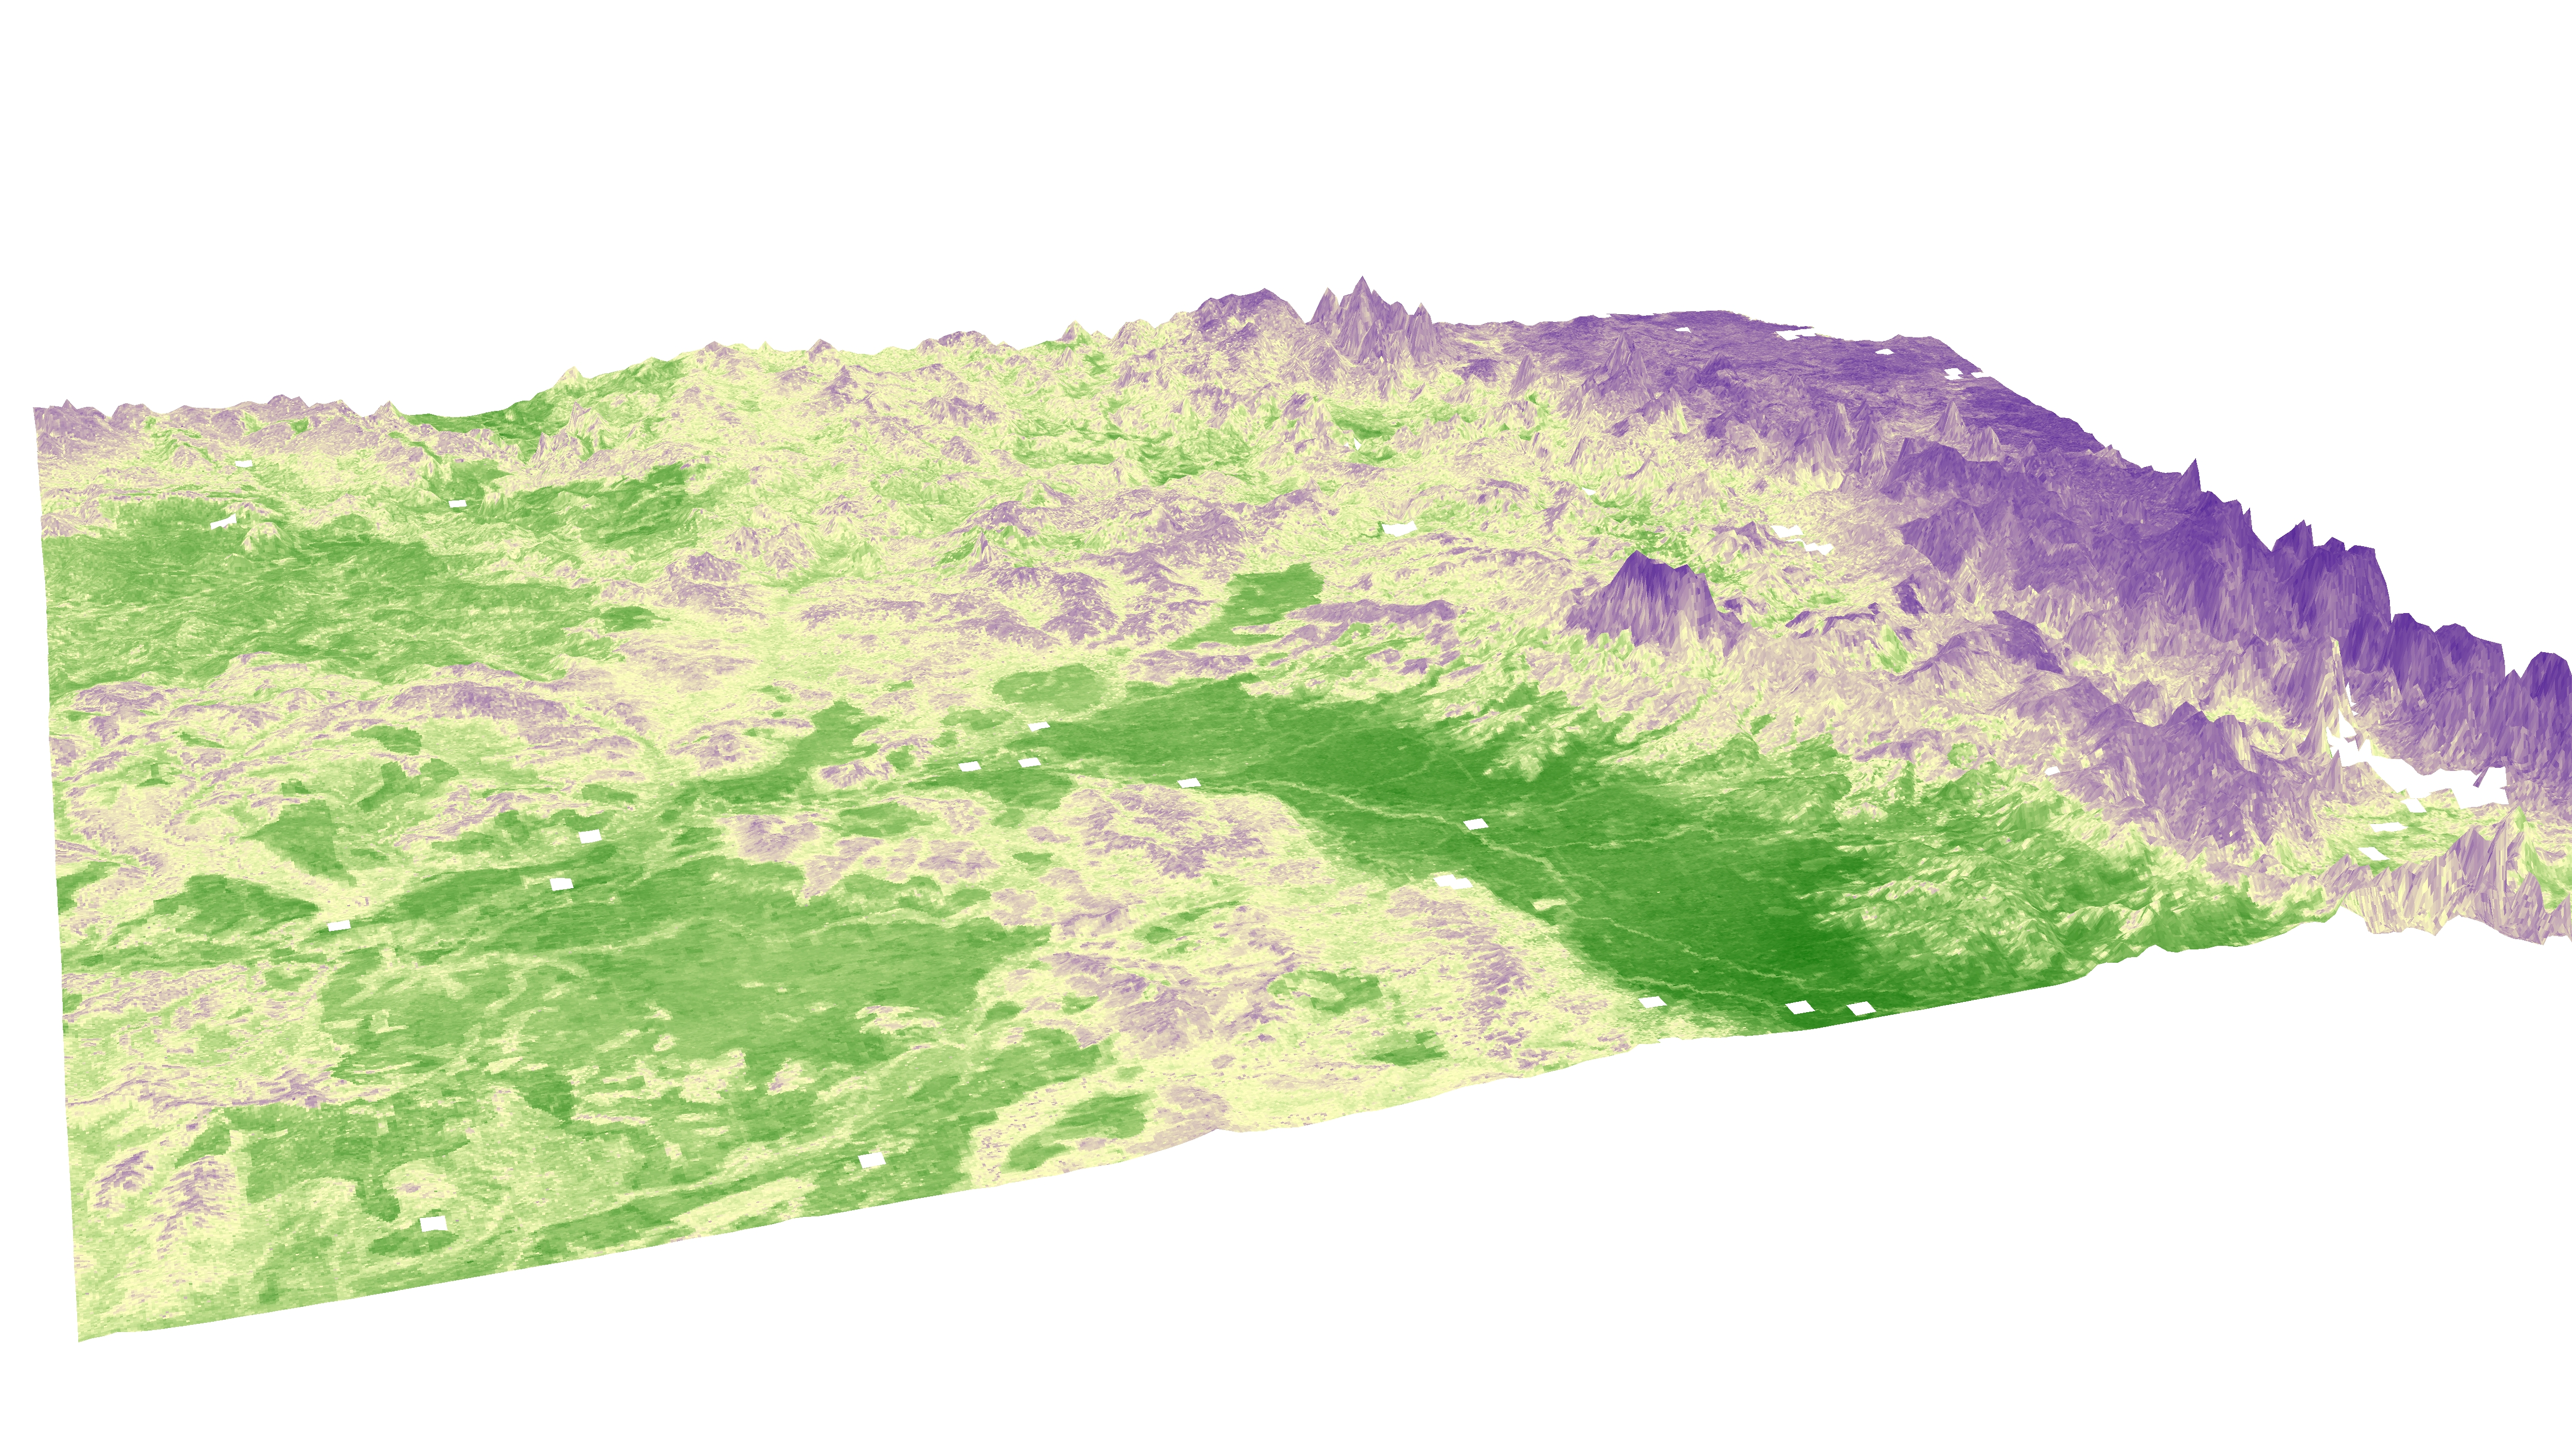
The Darling Downs as seen in the Grid
The best thing of all is that it’s freely available to everybody online.
For those keen beans like farmers, land managers, urban and regional planners and environmental scientists, who want to dig into the data, the files can be accessed through the Grid website in sections or the complete set is available through CSIRO’s Data Access Portal.
The data in the Grid can be sucked into a wide range of other databases and computer modelling programs and is useful to loads of different research projects. It is also part of Australia’s contribution to the GlobalSoilMap project.
For those who don’t want to get bogged down in the detail, check out our animation, which takes you on the journey of the Grid.
It’s been big collaborative effort with a large team bringing together the best minds for the job. The Grid is ready and waiting for new data, some of which will no doubt come from technology that hasn’t even been invented yet (kangaroos with laser scanners on their heads anyone? Or is that TOO weird?)
For now, though, why not marvel at the beauty of the soil and landscape through the digital eyes of the Grid.

17th December 2014 at 10:32 am
Great work — it is so important to get this data into the public domain.
You might have heard of the “semantic web” (or “linked data”) as a new way to publish data on the web for consumption by machines, ie reusing in software applications. Well, now data like this is being tackled — see the new joint W3C/OGC standards group to start in January: http://www.w3.org/2014/spatial/charter Please contact me if you want to get involved, or if the Soil and Landscape Grid could be a driving use case for the development of the standards.
27th November 2014 at 5:00 pm
Great work!! Is there any parallel effort to identify the corresponding microbial population structure and overlay it on these maps?
28th November 2014 at 6:17 pm
Woo! That’s a hard one. We’ll ask, but it might not be a quick answer.
26th November 2014 at 10:35 pm
This is great – as a geologist I love maps and free data! Thanks for all your work and for sharing it with all of us.
26th November 2014 at 6:11 pm
Great story about great work. But why do we keep referring to soil as “dirt” ? Aaaargh !