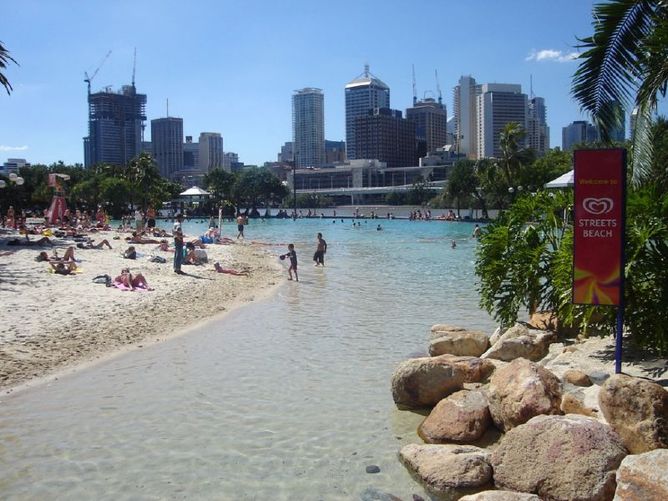
Future Sydney? Climate projections show Sydney’s climate could end up more like Brisbane’s. Image: Kevin Gibbons/Flickr, CC BY
Australia is on track for up to 1.7C of warming this century if the world curbs its greenhouse emissions, but under a worst-case scenario could see anything from 2.8C to 5.1C of warming by 2090, according to new climate change projections released by the CSIRO and the Bureau of Meteorology.
The projections are the most comprehensive ever released for Australia. They are similar to those published in 2007, but based on stronger evidence, with more regional detail. These projections have been undertaken primarily to inform the natural resources management sector, although the information will be useful for planning and managing the impacts of climate change in other sectors.
Possible futures
The new report draws on climate model data used by the Intergovernmental Panel on Climate Change (the IPCC). The Fifth IPCC Assessment Report (AR5), released in 2013 and 2014, used a range various greenhouse gas and aerosol scenarios to project future climate change.
Over the past 10 years, carbon dioxide emissions have been tracking the highest IPCC emission scenario (known as RCP8.5). If there is limited international action to reduce emissions, then projections based on the highest scenario may be realised.
However, if emissions are significantly reduced over the coming decades, then intermediate emissions (RCP4.5) might be feasible. Following the low emissions scenario (RCP2.6) would be very challenging given the current trajectory of carbon dioxide emissions.
How does Australia compare?
By late in this century (2090), Australia’s average warming is projected to be 0.6 to 1.7C for a low emission scenario, or 2.8 to 5.1C under a high emission scenario.
The warming under the high scenario is similar to the global average warming of 2.6 to 4.8C under the high emission scenario reported by the IPCC AR5. However, inland areas of Australia will warm faster than coastal areas.
For example, the Rangelands of inland Australia warm by 2.9-5.3C by 2090 under high emissions, while the East Coast, including Sydney and Brisbane, warms by 2.7-4.7C.
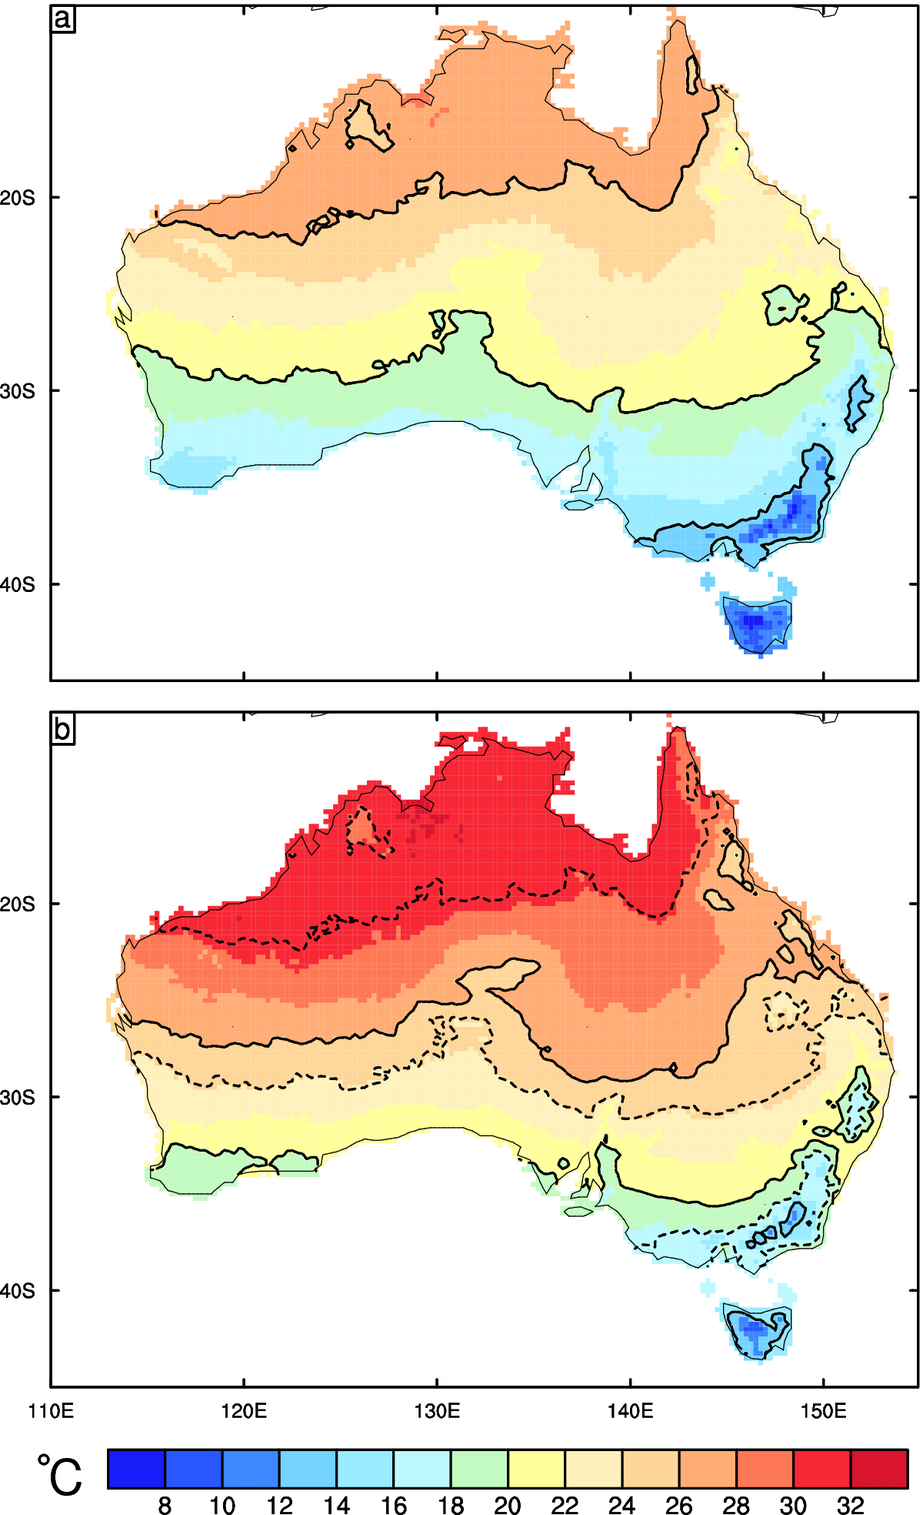
This map shows the annual mean temperature for present climate (A), and late 21st century (B). In each panel the 14C, 20C, and 26C contours are shown with solid black lines. In (B) the same contours from the original climate are plotted as dotted lines to provide the clearest depiction of the shifts in climate.
Historical context
The new projections should be viewed in the context of what has already been observed. Australia has become 0.9C warmer since 1910. Rainfall has increased in northern Australia since the 1970s and decreased in south-east and south-west Australia.
More of Australia’s rain has come from heavy falls and there has been more extreme fire weather in southern and eastern Australia since the 1970s. Sea levels have risen by approximately 20 cm since 1900.
In future, Australia’s average temperature will increase and we will experience more heat extremes and fewer cold extremes. Winter and spring rainfall in southern Australia is projected to decline while changes in other regions are uncertain.
For the rest of Australia, natural climate variability will predominate over rainfall trends caused by increasing greenhouse gases until 2030. By 2090, a winter rainfall decrease is expected in eastern Australia, but a winter rainfall increase is expected in Tasmania.
Historical climate data can be used as an analogue for the future. The analogue could be a location that currently has a climate similar to that expected in another region in the future.
For example, for a warming of 1.5-3.0C and a rainfall decrease of 5-15%, Melbourne’s climate becomes similar to that of Clare in South Australia, Sydney becomes more like Brisbane, and Brisbane becomes more like Bundaberg in inland Queensland.
Extreme rainfall events that lead to flooding are likely to become more intense. The number of tropical cyclones is projected to decrease but they may be more intense and possibly reach further south. Southern and eastern Australia is projected to experience harsher fire weather. The time in drought will increase over southern Australia, with a greater frequency of severe droughts.
A projected increase in evaporation rates will contribute to a reduction in soil moisture across Australia. There will be a decrease in snowfall, an increase in snowmelt, and therefore reduced snow cover.
Sea levels will continue to rise throughout the 21st century and beyond. Oceans around Australia will warm and become more acidic.
What will Australia look like?
Freshwater resources are projected to decline in far south-west and far south-east mainland Australia. Rising sea levels and increasing heavy rainfall are projected to increase erosion and inundation, with consequent damage to many low-lying ecosystems, infrastructure and housing.
Increasing heat waves will increase risks to human health. Rainfall changes and rising temperatures will shift agricultural production zones. Many native species will suffer from reduced habitats and some may face local or even global extinction.
The most vulnerable regions/sectors are coral reefs, increased frequency and intensity of flood damage to infrastructure and settlements, and increasing risks to coastal infrastructure and low-lying ecosystems.
While reductions in global greenhouse gas emissions would increase the chance of slowing climate change, adaptation is also required because some warming and associated climate changes are unavoidable.
![]()
This article was originally published on The Conversation. Read the original article.

31st July 2018 at 4:13 pm
Well, it’s certainly not clear that 8.5 is “unlikely”. Quite the contrary – on present trajectory, it is scarily likely. Time to stop searching for flaws in the evidence and do whatever is needed, locally and globally, to avert this existential threat while there’s still a slight chance of succeeding.
5th February 2015 at 3:19 pm
To give the forecast more credibility, instead of jumping out to predict a 2090 scenario, why can’t a year by year progression toward the 2090 end forecast be presented. That way , in 5, 10 years we would have an “on track” conclusion or early exposure of a flawed 2015 assessment.
6th February 2015 at 3:12 pm
Year-by-year predictions of the final average temperature figures are not really that useful in testing the proposition presented here, since there are many unpredictable elements that influence the result. However, these unpredictable elements are also cyclic and will have little impact in the long-term. Therefore, you can benefit from digging a little deeper, and look at the predictions for the constituent elements.
On this basis, the prediction used here (on the worst case scenario) of carbon emissions in 2020 is 12 gigatonnes. This compares with 9 gigatonnes in 2010, and a linear increase being projected between these two dates.
However, this information is not that useful, since figures for carbon emissions are not easily accessible: they have not been fully revised since 2010! More useful, and easily obtained, are the atmospheric levels of the various greenhouse gases (GHGs). Using this basis, the track record of the IPCC has not been too flash.
The IPCC 1990 assessment was for a 0.15C to 0.20C increase in temperature per decade. This was not achieved, primarily on account of overstatement of the likely atmospheric levels of the main greenhouse gases (GHG). Each one was overstated as at 2010, except nitrous oxide (N2O):
CO2 – estimated 2010 397 ppm; actual 390 ppm
Methane – estimated 2010 2223 ppb; actual 1795 ppb
N2O – estimated 2010 321 ppb; actual 324 ppb
In the 2007 report by the IPCC, there was still belief that Methane would spiral upwards, so the earlier forecasts were just pushed to the right. The latest (2014) forecasts are even worse, since they are difficult to track back to predicted GHG levels of the components. Yet from the Peters article cited in the above comments, the latest worst case forecasts lack credibility, since they appear to be no better than a mathematical projection of current CO2 emissions levels continuing unabated. (Goodness knows what the IPCC included for methane – it is a bit hard to find out.)
It is interesting to observe that the calculation of the “forcing” from GHGs, as found in the IPCC reports, can be considered quite robust. After this is accepted, the difficulties in the IPCC’s forecasts of temperature increases arise from two problems. The first is the failure to accurately forecast likely atmospheric levels of GHGs, and the second from converting “forcing” into the increase in temperature, which also appear to be overstated by the IPCC. Nevertheless, the data does demonstrate that GHGs are pushing up the temperature at a fairly consistent rate. As a result, (thankfully) the world is working to reduce emissions of CO2 and the other GHGs, and the worse case scenario is quite unlikely to be realised.
12th February 2015 at 3:10 pm
Thanks John,
As a matter of interest, what is the composition of the huge effluxes from the various volcanic eruptions we read about and which from time to time seem to outshine any human misdemeanors?
13th February 2015 at 12:18 pm
Not all volcanic eruptions have a significant impact on global average temperatures, but when they do, the impact of their sulphur emissions overrides all other impacts. It results in a temporary reduction in temperatures, sometimes for up to 3 years.
The major requirement for a measurable global temperature impact is for the Volcanic plume to fully enter the stratosphere.
For the last 3 major volcanic periods, the following is indicative of their impacts:
1980, Mt St Helens, USA, temp. reduction in 1980/1 year of 0.05C
1982, El Chichon, Mexico, max. temp. reduction was in 1982/83 year of 0.11C
1991, Mt Pinatubo, Philippines & Cerro Hudson, Chile, max. temp. reduction was in 1992/3 of 0.20C
The bigger the eruption, the longer the impact stays around.
While much can be made of the effects of volcanic eruptions, they are temporary, while the impact of higher emissions of CO2 results in higher CO2 levels each year. Although higher greenhouse gas emissions probably only increase the temperature by 0.01C in any one year, each year’s increase adds to the previous year’s. It eventually adds up, and overwhelms the cyclic factors.
4th February 2015 at 1:17 pm
Are the authors of the report saying that the temperature rises that they predict are 100% due to CO2 emissions? or has natural variability been included in these temperature projections in some way? Judith Curry in the US and others are concerned that the models are not handling this issue very well.
10th February 2015 at 11:06 am
Hi Costa,
Sorry for the delay. We put your question to the team that worked on the report, and they have come back with the following.
“Yes, our climate projections for the 21st century include natural variability and the effects of four scenarios of future greenhouse gases (including CO2) and aerosols (fine particles in the atmosphere).
While the IPCC recognises that climate trends based on short records can be skewed by natural climate variability, it is extremely likely that human influence has been the dominant cause of observed warming since the mid-20th century. Greenhouse gases contributed a global mean surface warming likely to be in the range of 0.5°C to 1.3°C over the period 1951−2010, with the contributions from other anthropogenic forcings, including the cooling effect of aerosols, likely to be in the range of −0.6°C to 0.1°C. The contribution from natural forcings is likely to be in the range of −0.1°C to 0.1°C. Together these contributions are consistent with the observed warming of approximately 0.6°C to 0.7°C over this period.
There is a useful guide on natural variability in Box 6.2.2 of the Technical Report at http://www.climatechangeinaustralia.gov.au/en/publications-library/technical-report/. For some variables such as annual mean temperature, projected changes are outside the range of natural variability by the end of the 21st Century (see Fig 7.1.1 in the Technical Report). For other variables such as rainfall, the ranges of change may not be so clearly distinct from the range of natural variability (see Fig 7.2.1 in the Technical Report).”
Thanks
Adam
CSIRO Social Media team
12th February 2015 at 3:05 pm
Science ? Too many “likelies” make me nervous when others are saying no warming in the last 16 years