 The Principle Investigator for the recent Indian Ocean voyage, Professor Nathan Bindoff, from the Institute for Marine and Antarctic Studies, has sent through and update.
Turns out they’ve been very busy onboard Southern Surveyor!
So why are we doing this research voyage?
The world is a changing place, and the oceans are playing an important role on those measured changes.
Climate change is causing the oceans to warm, causing some parts of the ocean to become more salty (from greater evaporation and lower rainfall), and some regions to become fresher (from increased rainfall).
We do not fully understand how the ocean circulates, where the waters are coming from and going to. This animation helps to explain what we do know and where the major ocean currents around Australia travel, which was created by CSIRO, the Wealth from Oceans Flagship and the Australian Climate Change Science Program.
This voyage is about discovering this sort of information about the southern parts of the Indian Ocean.
The aims of our research project are to:
- Obtain new observations of the surface eastward flows and underlying westward flows.
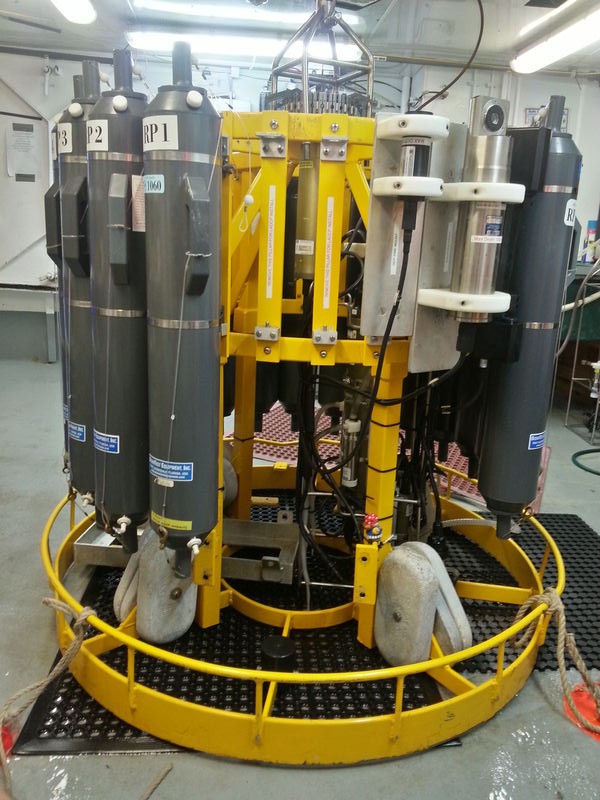
To do this we are deploying floats that can measure the ocean currents, temperatures and salinities, which can measure ocean currents down to 1600 metres, and will do so for several months. We are also deploying surface drifters, which lie on the surface of the ocean, where they are blown by the wind and dragged by the surface ocean currents. - Identify where the ocean currents come from, and how they drive circulation.
Some ocean currents have particular temperatures, salinities and oxygen levels and we can use this chemical and physical information to trace where they came from and where they are going. For example cold waters that are fresh and rich in oxygen come all the way from the surface of the Southern Ocean. - The ocean is constantly stirred.
We also measure the stirring of the ocean using a probe designed specifically for this task (the crew thinks it looks like a test tube brush). - The ocean has a surface that interacts with the atmosphere.
Indeed almost all the rain that falls on land was originally evaporated off the ocean. We are going to measure the surface evaporation (winds, temperatures and humidity) for years to come. To do this we deployed a mooring in the ocean, which is anchored in 5,000 metres of ocean depth.

When we get back to the laboratory we will use all of the data, from all of these experiments and equipment, and combine it with computer generated ocean models, and ocean physics, to understand the patterns of flow near the surface and all the way to the bottom of the ocean (5,000 metres below the surface). We will also compare the new temperature, salinity and oxygen data to see how much the ocean water has changed from the surface to the sea floor. And, answer questions like, has the ocean become warmer or more salty, and is there more evaporation?
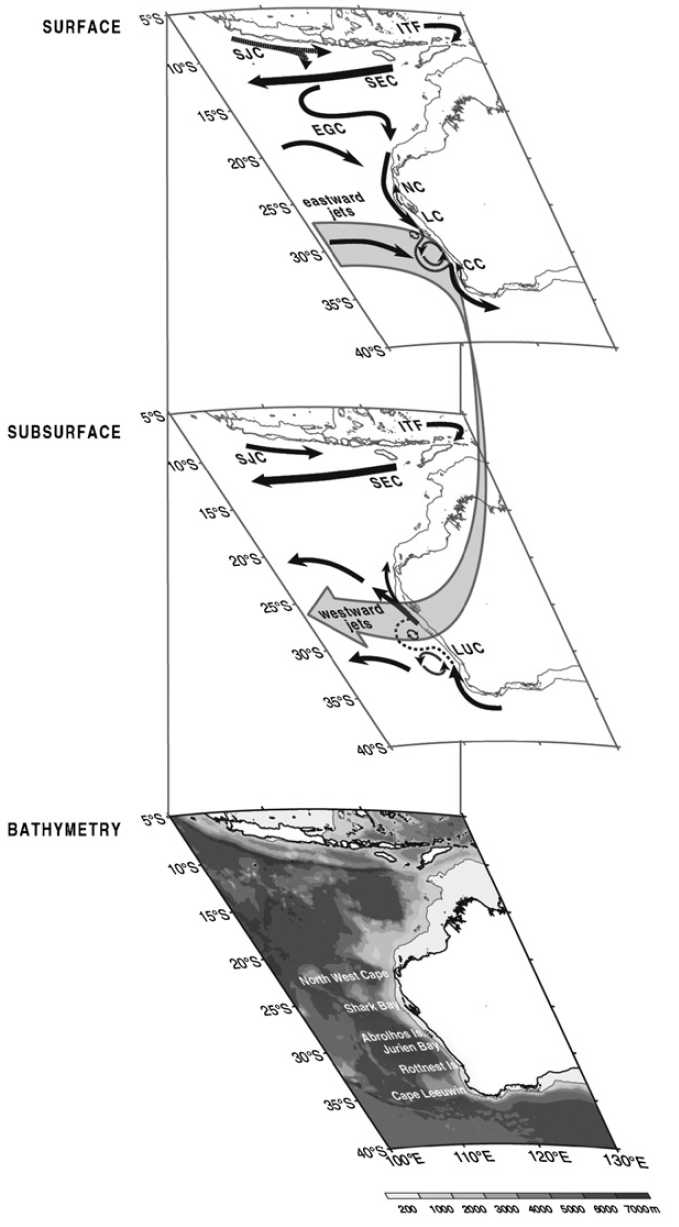
So what have we done so far: the Leeuwin Current system.
The Leeuwin Current is a thin narrow current that flows along the West Australian coastline. It gets progressively stronger as it heads toward Cape Leeuwin. From space this current looks like a warm ribbon of water following the coastline, and extends beyond Cape Leeuwin into the Great Australian Bight. In other oceans, similar currents are found on the eastern side, except they all flow towards the equator. The Leeuwin is the only current of this type that flows away from the equator. Beneath the Leeuwin Current there is a current that flows northwards. This current is called the Leeuwin under current.
On this research voyage we have made measurements of the temperature and salinity, vertically, from the surface to the seafloor. These measurements are made from a CTD, which is a conductivity -temperature-depth instrument. This instrument also measures ocean currents with a Lowered Acoustic Doppler Current Profiler (LADCP). So far we have completed 13 profiles. At times the surface currents exceeded 0.75 m/s or about 2.7 kilometres an hour.
We are trying to answer questions like, what is the speed and size of the Leeuwin Current, is there a strong undercurrent, and with our models find the explanation for the reasons why the flow is southward unlike all the other similar current systems around the world.