The Paris climate agreement seeks to limit global warming to 1.5℃ this century. A new report by the World Meteorological Organisation warns this limit may be exceeded by 2024 – and the risk is growing.
This first overshoot beyond 1.5℃ would be temporary, likely aided by a major climate anomaly such as an El Niño weather pattern. However, it casts new doubt on whether Earth’s climate can be permanently stabilised at 1.5℃ warming.
This finding is among those just published in a report titled United in Science. We contributed to the report, which was prepared by six leading science agencies, including the Global Carbon Project.
The report also found while greenhouse gas emissions declined slightly in 2020 due to the COVID-19 pandemic, they remained very high – which meant atmospheric carbon dioxide concentrations have continued to rise.
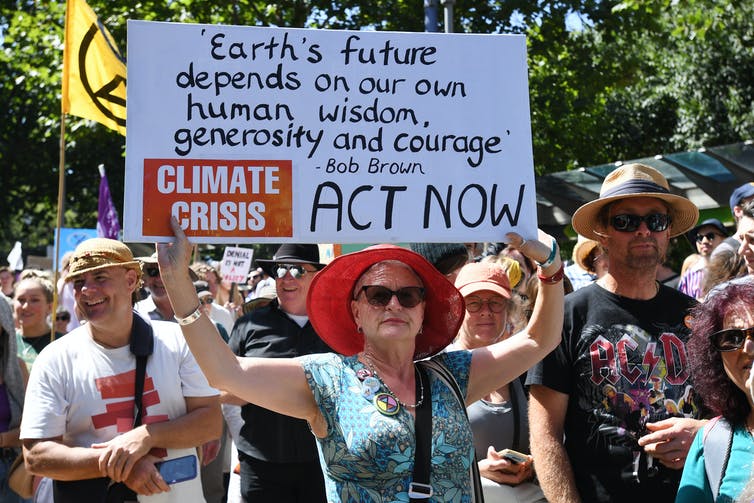
The world may exceed the 1.5℃ warming threshold sooner than we expected.
Erik Anderson/AAP
Greenhouse gases rise as CO₂ emissions slow
Concentrations of the three main greenhouse gases – carbon dioxide (CO₂), methane (CH₄) and nitrous oxide (N₂O), have all increased over the past decade. Current concentrations in the atmosphere are, respectively, 147%, 259% and 123% of those present before the industrial era began in 1750.
Concentrations measured at Hawaii’s Mauna Loa Observatory and at Australia’s Cape Grim station in Tasmania show concentrations continued to increase in 2019 and 2020. In particular, CO₂ concentrations reached 414.38 and 410.04 parts per million in July this year, respectively, at each station.

Atmospheric concentrations of carbon dioxide (CO₂), methane (CH₄) and nitrous oxide (N₂0) from WMO Global Atmosphere Watch.
Growth in CO₂ emissions from fossil fuel use slowed to around 1% per year in the past decade, down from 3% during the 2000s. An unprecedented decline is expected in 2020, due to the COVID-19 economic slowdown. Daily CO₂ fossil fuel emissions declined by 17% in early April at the peak of global confinement policies, compared with the previous year. But by early June they had recovered to a 5% decline.
We estimate a decline for 2020 of about 4-7% compared to 2019 levels, depending on how the pandemic plays out.
Although emissions will fall slightly, atmospheric CO₂ concentrations will still reach another record high this year. This is because we’re still adding large amounts of CO₂ to the atmosphere.
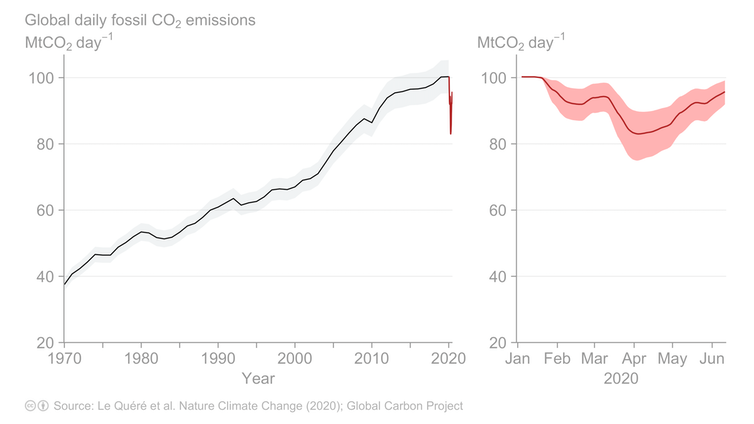
Global daily fossil CO₂ emissions to June 2020. Updated from Le Quéré et al. 2020, Nature Climate Change.
Warmest five years on record
The global average surface temperature from 2016 to 2020 will be among the warmest of any equivalent period on record, and about 0.24℃ warmer than the previous five years.
This five-year period is on the way to creating a new temperature record across much of the world, including Australia, southern Africa, much of Europe, the Middle East and northern Asia, areas of South America and parts of the United States.
Sea levels rose by 3.2 millimetres per year on average over the past 27 years. The growth is accelerating – sea level rose 4.8 millimetres annually over the past five years, compared to 4.1 millimetres annually for the five years before that.
The past five years have also seen many extreme events. These include record-breaking heatwaves in Europe, Cyclone Idai in Mozambique, major bushfires in Australia and elsewhere, prolonged drought in southern Africa and three North Atlantic hurricanes in 2017.
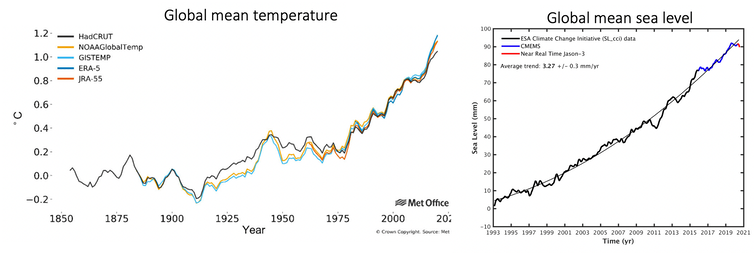
Left: Global average temperature anomalies (relative to pre-industrial) from 1854 to 2020 for five data sets. UK-MetOffice. Right: Average sea level for the period from 1993 to July 16, 2020. European Space Agency and Copernicus Marine Service.
1 in 4 chance of exceeding 1.5°C warming
Our report predicts a continuing warming trend. There is a high probability that, everywhere on the planet, average temperatures in the next five years will be above the 1981-2010 average. Arctic warming is expected to be more than twice that the global average.
There’s a one-in-four chance the global annual average temperature will exceed 1.5℃ above pre-industrial levels for at least one year over the next five years. The chance is relatively small, but still significant and growing. If a major climate anomaly, such as a strong El Niño, occurs in that period, the 1.5℃ threshold is more likely to be crossed. El Niño events generally bring warmer global temperatures.
Under the Paris Agreement, crossing the 1.5℃ threshold is measured over a 30-year average, not just one year. But every year above 1.5℃ warming would take us closer to exceeding the limit.
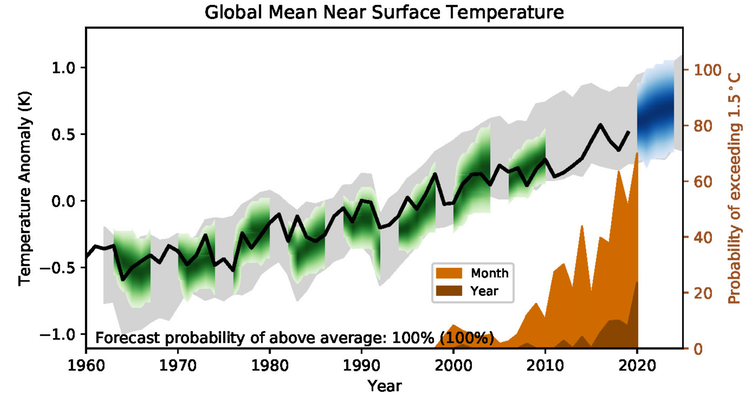
Global average model prediction of near surface air temperature relative to 1981–2010. Black line = observations, green = modelled, blue = forecast. Probability of global temperature exceeding 1.5℃ for a single month or year shown in brown insert and right axis. UK Met Office.
Arctic Ocean sea-ice disappearing
Satellite records between 1979 and 2019 show sea ice in the Arctic summer declined at about 13% per decade, and this year reached its lowest July levels on record.
In Antarctica, summer sea ice reached its lowest and second-lowest extent in 2017 and 2018, respectively, and 2018 was also the second-lowest winter extent.
Most simulations show that by 2050, the Arctic Ocean will practically be free of sea ice for the first time. The fate of Antarctic sea ice is less certain.
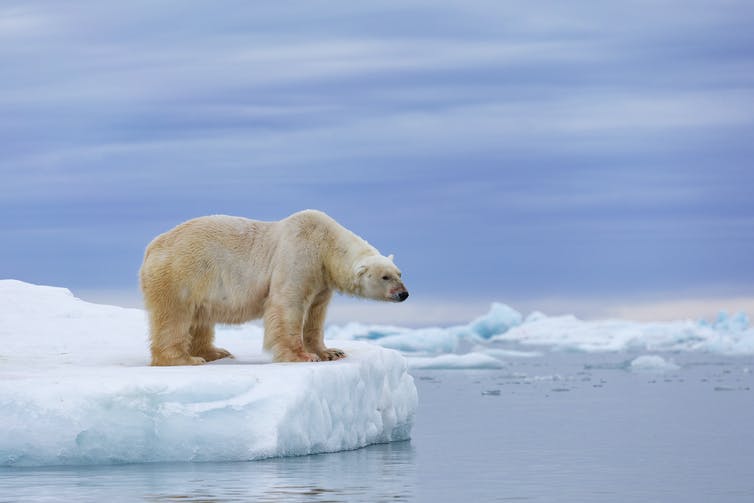
Summer sea ice in the Arctic is expected to virtually disappear by 2050.
Zaruba Ondrej/AP
Urgent action can change trends
Human activities emitted 42 billion tonnes of CO₂ in 2019 alone. Under the Paris Agreement, nations committed to reducing emissions by 2030.
But our report shows a shortfall of about 15 billion tonnes of CO₂ between these commitments, and pathways consistent with limiting warming to well below 2℃ (the less ambitious end of the Paris target). The gap increases to 32 billion tonnes for the more ambitious 1.5℃ goal.
Our report models a range of climate outcomes based on various socioeconomic and policy scenarios. It shows if emission reductions are large and sustained, we can still meet the Paris goals and avoid the most severe damage to the natural world, the economy and people. But worryingly, we also have time to make it far worse.
This article is republished from The Conversation under a Creative Commons license. Read the original article.


14th September 2020 at 2:02 am
The claims here about Arctic-ocean sea ice disappearing between 1979-2019 is little more than cherry picking by Climate Deceivers. Artic Sea Ice waxes & wans as do glaciers. There have been MANY past instances of low levels of Arctic sea ice sufficient to facilitate transit of the famed Northwest passage dating back to 1903-06 by the vessel Gjoa skippered by Roald Amundsen well documented here http://www.nauticapedia.ca/Articles/NWP_Fulltransits.php#:~:text=Transiting%20the%20North%20West%20Passage%3A%20Any%20vessel%20crossing,by%20the%20Russian%20icebreaker%20Kapitan%20Khlebnikov%20carrying%20passengers.
10th September 2020 at 11:29 am
There is another situation affected by CO2, the sea. It is steadily becoming less alkaline, moving from a concentration where solid calcium carbonate can exist with calcium bicarbonate. Keep going and goodbye oysters, prawns and more.
10th September 2020 at 11:21 am
More scaremongering. The data is for A very select narrow period – what happened before then? Why is such an arbitrary base chosen?