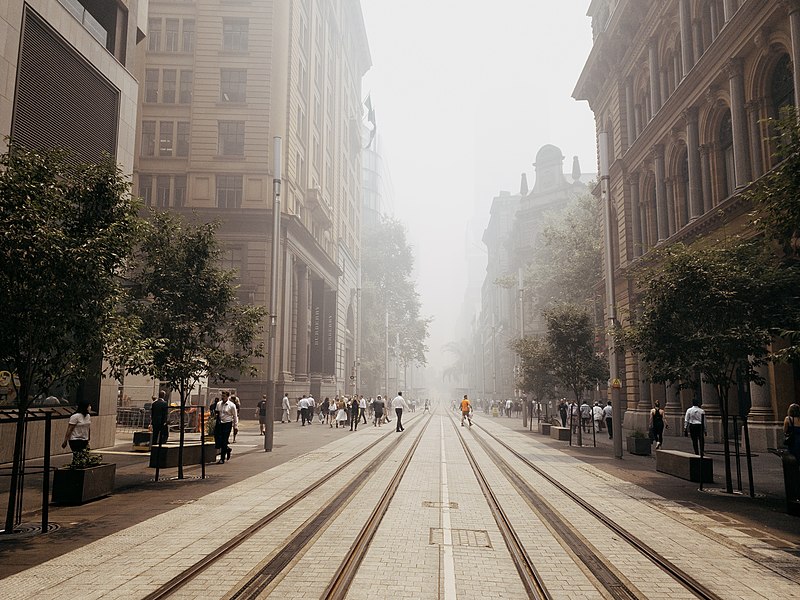
Smoke is blanketing our cities as a result of bushfires burning across the country.
Over the past several weeks, many Australian communities have been experiencing poor and hazardous air quality. This is as devastating and widespread bushfires continue to sweep across the country.
For those more vulnerable to air quality, such as asthma sufferers, it can feel like the smoke is inescapable.
We expect the fires will continue well into summer. Accessing up-to-date, accurate, air quality forecasts are vital in minimising people’s exposure to smoke and dangerous particles. Our technology is being used to do just that.
Steering clear of PM2.5
The haze blanketing our streets and infiltrating homes and buildings is also a health concern. This is a result of elevated levels of tiny air particles called PM2.5 carried by bushfire smoke.
Exposure to high levels of PM2.5 can cause short and long-term health impacts like respiratory and heart conditions and stroke. Specific types of face masks can offer a level of protection, but it’s better to reduce exposure in the first place.
Our forecasting system called AQFx (Air Quality Forecasting X) provides hourly and daily information on, and forecasts of, the location and movement of PM2.5 and other pollutants in the air.
One of our scientists working on the modelling system, Fabienne Reisen, explains how it works.
“We measure these particles in the air using a network of low-cost sensors that collects data. Then we visualise the data on a high-resolution map,” she said.
“AQFx provides emergency services teams, environmental protection agencies and health services across Australia with important information on hazardous air quality. We use the data from the network to assess the performance of AQFx.”
How AQFx works
We designed the AQFx system to support government decisions on whether and where to safely conduct fuel reduction burns. But during the current Australian bushfire events it’s being used to provide daily forecasts of air pollutants including smoke.
Environmental protection agencies and fire services are using its valuable data to assess community smoke impacts. Then they can determine risk and provide alerts.
The model predicts smoke plume spread and downwind concentrations from planned and unplanned fires. It integrates fire spread, smoke emissions and chemical transport models to make predictions.
We developed AQFx in collaboration with the Bureau of Meteorology (BoM) and several universities. It was funded by Victoria’s Department of Environment, Land, Water and Planning (DELWP). BoM operate the technology and it’s currently running in Victoria, Tasmania and New South Wales with plans to roll out nationally.
How AQFx has helped with air quality so far
The technology helped flag back in December that we would need a national response to tackle fires burning at the same time across multiple states and territories.
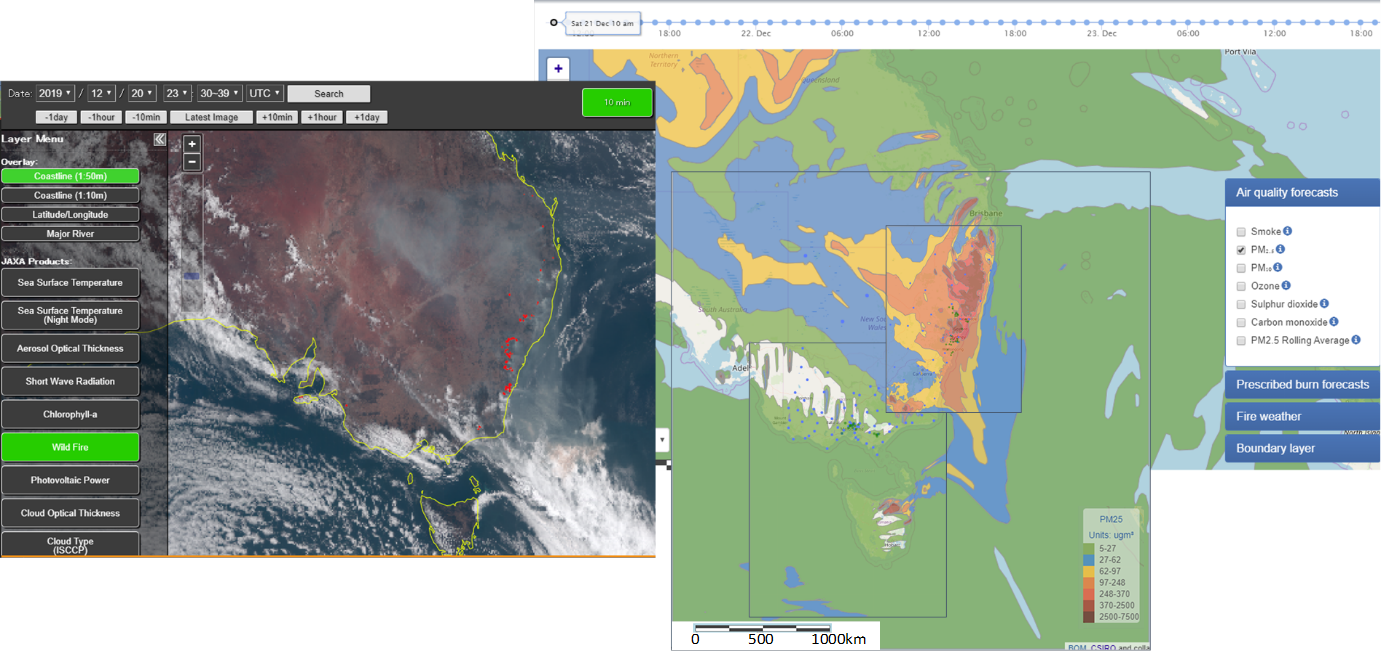
Visible satellite image taken by Himawari-8 (left); AQFx combined fine particle forecast for Vic-Tas and NSW domains (right)
The plot below shows an AQFx forecast of particles for south-east Australia (Victoria, Tasmania, and NSW) for Saturday 21 December. To the left is a visible satellite image taken by Himawari-8, a Japanese geostationary weather satellite.
“Looking back at this plot, it told us the scale of the air pollution, with elevated concentrations of fine particles spanning multiple states and territories,” Fabienne said.
“Even at this stage it was clear that to address the evolving catastrophe we needed a national-scale response.”
In many cases, the smoke has travelled long distances where fires aren’t present. For example, in Melbourne, which has experienced air quality pollution from Victorian and Tasmanian fires. Just a day earlier, on 20 December, smoke travelled approximately 200 km from a fire in the Oven’s Valley/Bright region to Melbourne.
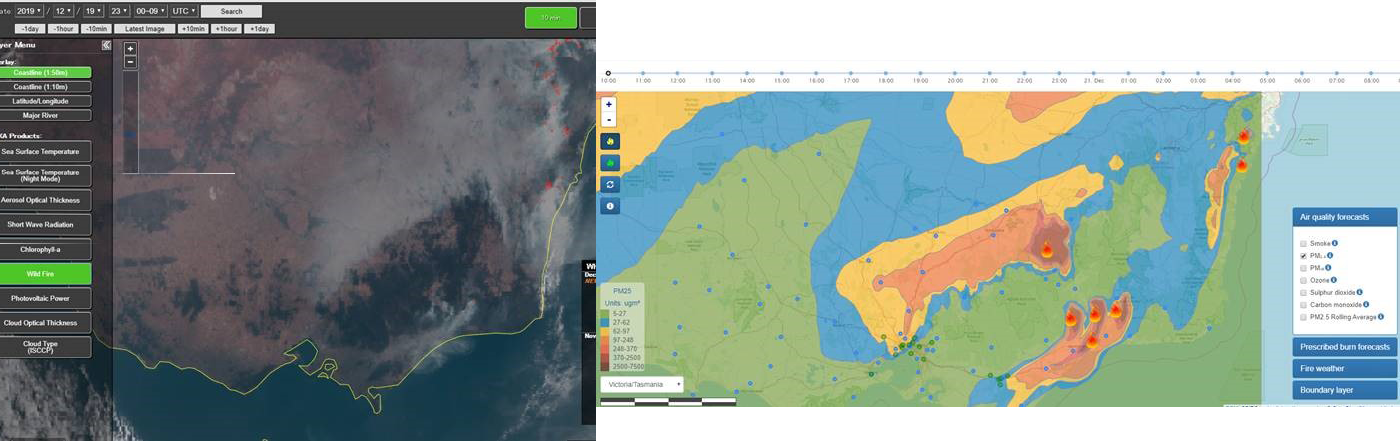
Visible satellite image taken by Himawari-8 (left); AQFx combined fine particle forecast for Melbourne (right).
“This was the first time during the 2019-20 bushfires Melbourne experienced such a large amount of smoke,” Fabienne said.
“The plot is also interesting. It shows how the Alps formed a barrier to the smoke plumes from fires in the north and south of Victoria. And the AQFx forecast picked this up well.”
Quality air and quality data
Beyond the front line of tackling the fires, city residents are seeing hazardous air pollution. And they are relying on the latest air quality data to weigh up working from home, outdoor fitness, how to entertain young children indoors during the school holidays, or keeping pets happy and healthy.
Our science is helping to provide information to underpin some of these now-complicated choices. Data from air quality monitoring networks—which include some systems we operate—feed into the AirRater app. The University of Tasmania developed the app and it is available to the public.
Fabienne told us they designed the app to help those who are vulnerable to poor air quality.
“AirRater provides information on smoke concentrations. But you can also log symptoms of asthma, allergies and hayfever,” she said.
“AirRater gathers these and matches with environmental conditions at the time. Together building a big picture of potential environmental triggers.”
The AQFx team is working on a project currently to extend the platform to pollen forecasting.
We are also collaborating on a school-based citizen science program in Victoria to help fire managers broaden the smoke monitoring network. In 2017, we developed a curriculum and low-cost smoke DIY sensor package for Grade 6-8 students called ‘SMOG’ (Smoke Observation Gadget). Find out more about SMOG.
More air quality information
To find out more air quality information in your area, visit the below links.
Australia wide
- Bureau of Meteorology smoke and air quality information
- Air pollution in Australia: Real-time air quality index visual map
- Air quality Australia
- Airrater phone app
- Centre for air pollution, energy and health research (CAR)

17th January 2020 at 1:39 pm
Ditto Cass. I saw this article earlier this week about how the ACT education directorate is responding to the situation re school going back… https://www.canberratimes.com.au/story/6574856/could-bushfire-smoke-shut-canberras-schools/
Seems like the directorate is taking this complex problem seriously which is good to see.
16th January 2020 at 1:25 pm
I’m generally healthy but the smoke where I live (Canberra) has now lingered long enough for me to start worrying, long term, for me and my kids. Not only is smoke itself a concern, but there’s the knock-on effect in other areas – we’ve practically stopped exercising and doing fun things in nature.
There seems to be vastly differing levels of concern, community wide, too. Added to that confusion, we’re in unchartered territory. With school going back soon, I do wonder if enough precautions will be taken for kids health..
15th January 2020 at 8:20 am
Well sub pm2.5 is a major problem as are the secondary combustion products which have been found to still be at dangerous levels in clear air up to 1000km downwind of the fires (USDA research). Then we have ozone generated at street level. Anything under 30nm gets into the bloodstream and any particle 5nm and up gets trapped in the liver and kidneys and under 5nm can still be found in the urine 4 months later.