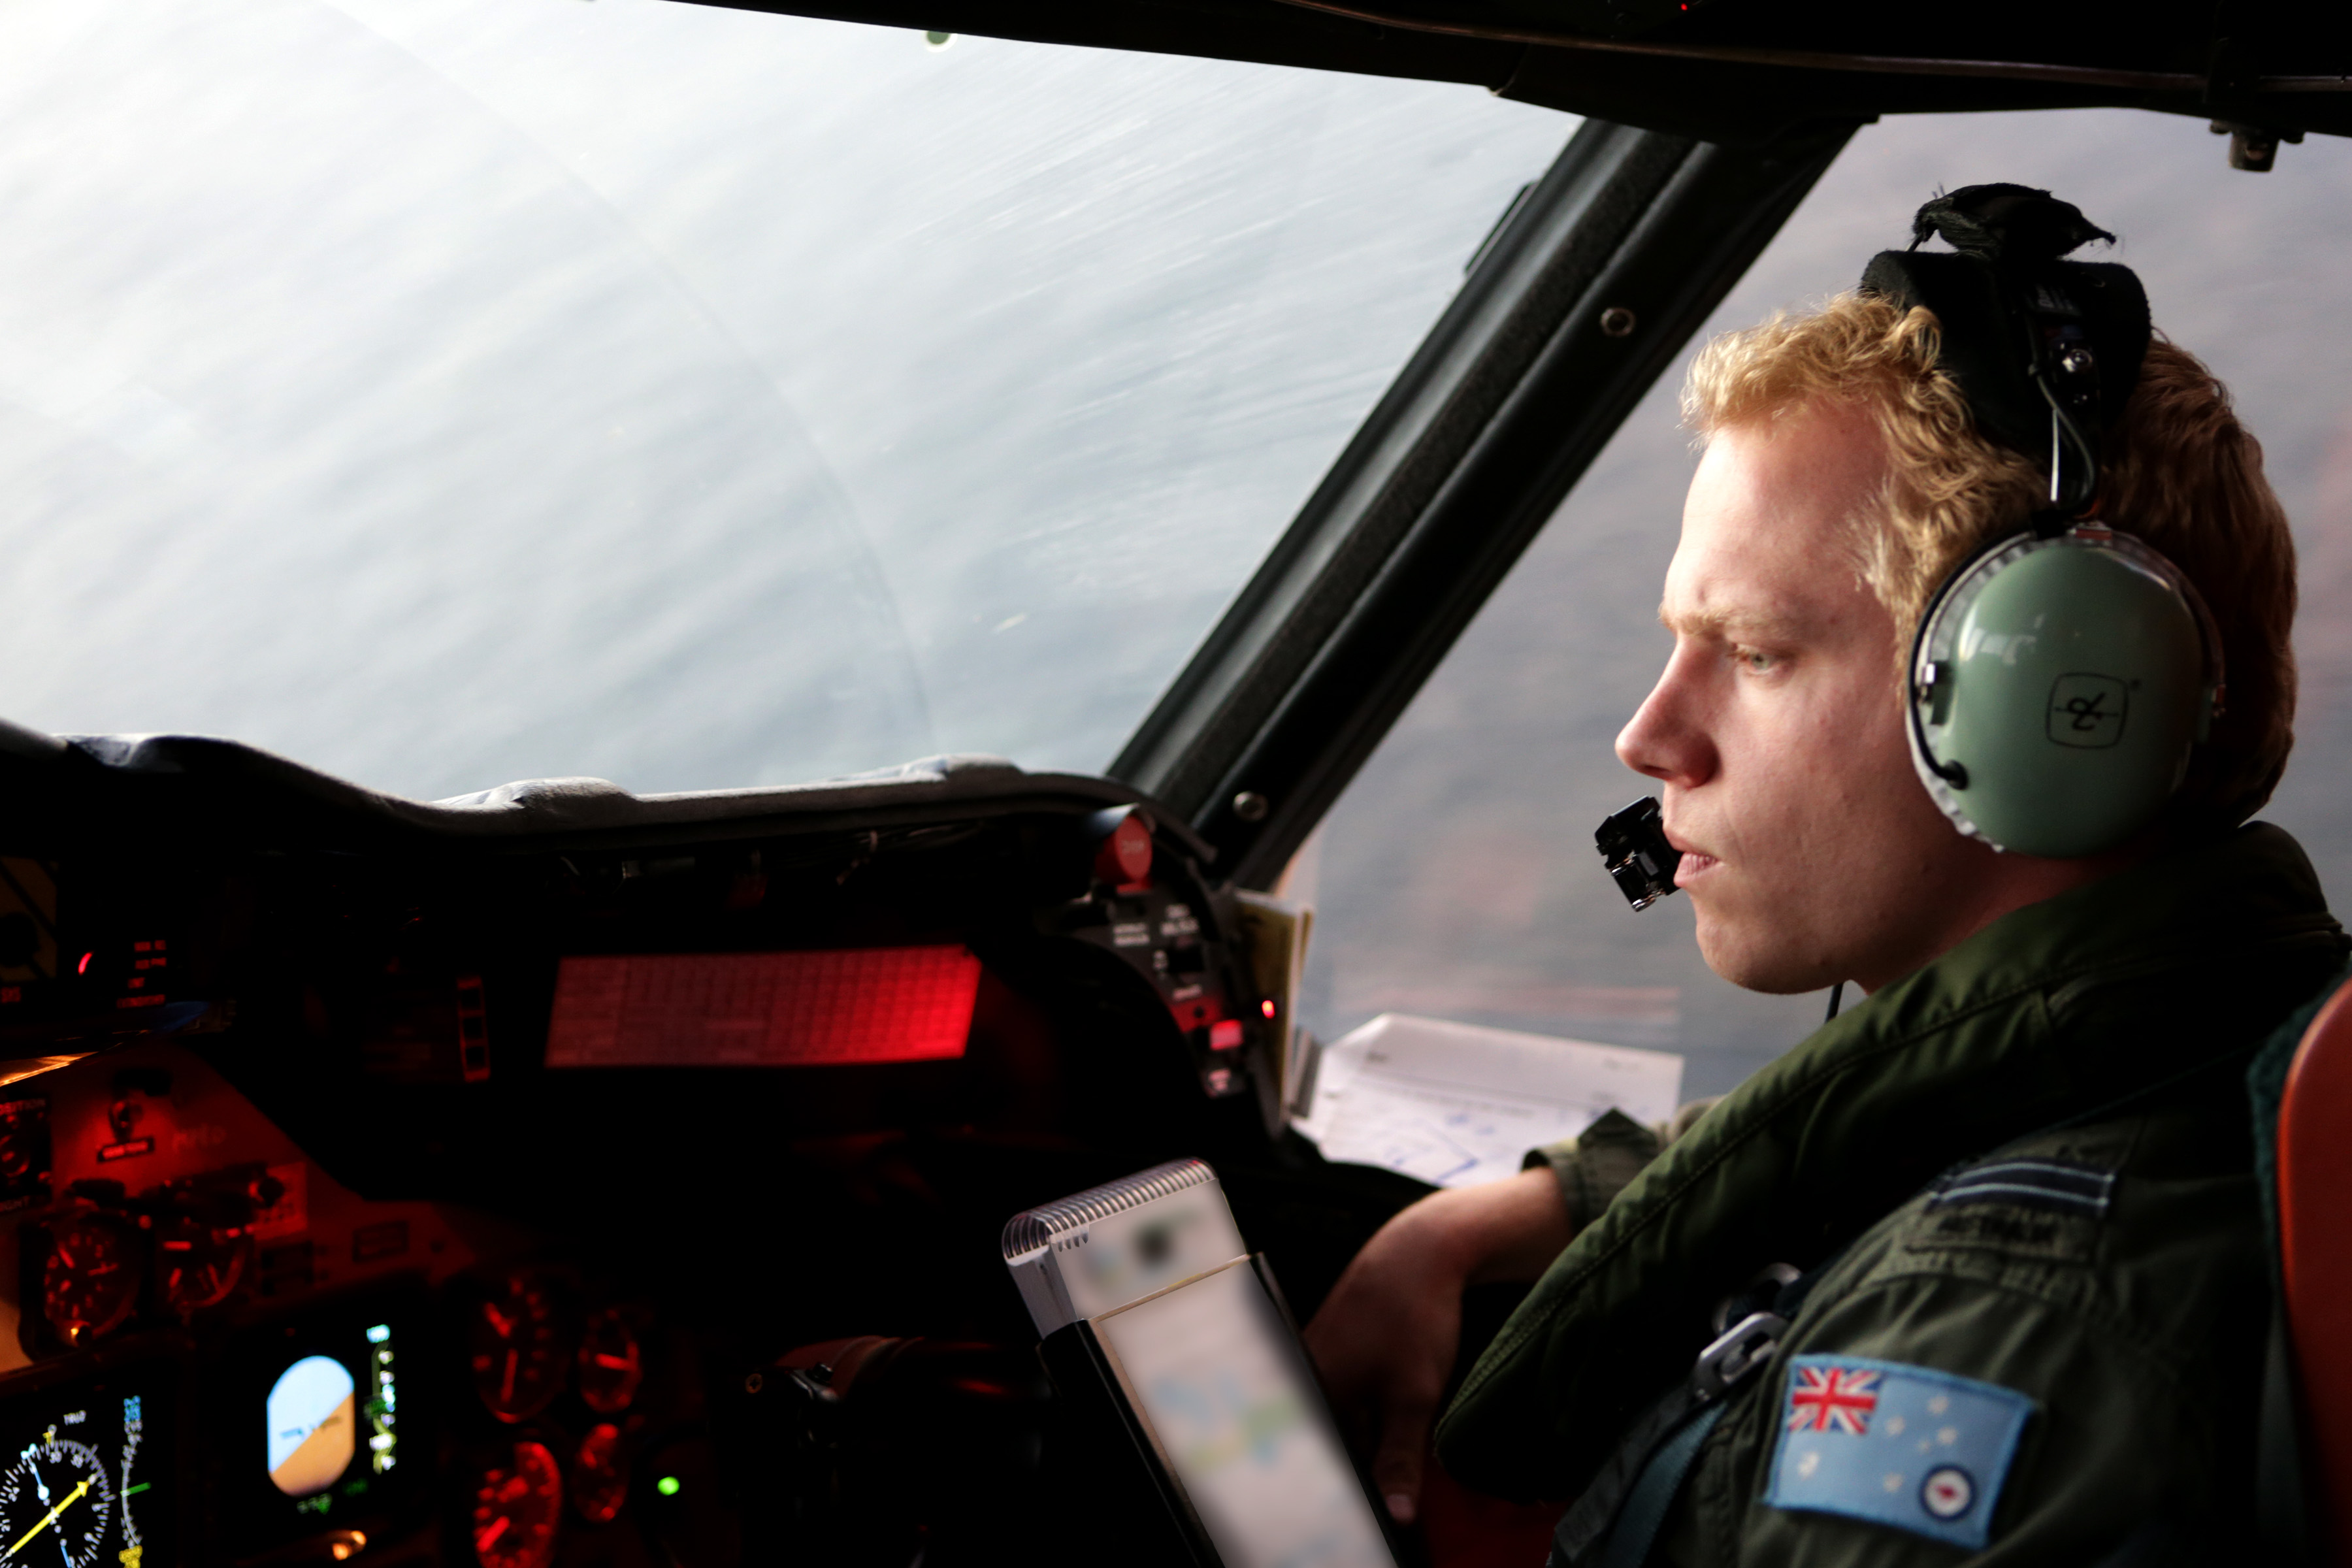
Aircraft captain, Flight Lieutenant Philip Tracey, from No.11 Squadron, onboard an AP-3C Orion during a Joint Task Force 639 search and rescue mission over the Indian Ocean on 13 August 2012.
Mid Caption: Operation RESOLUTE is the Australian Defence Force's contribution to the whole-of-government effort to protect Australias borders and offshore maritime interests. At any one time, up to 500 Australian Defence Force personnel at sea, in the air and on the land, are working to protect Australias borders and offshore maritime interests.
Image: Department of Defence
UPDATE 16/04/2014:
CSIRO continues to provide support to AMSA and the Joint Agency Coordination Centre (JACC) in the search for MH370 by way of oceanographic modelling and debris tracking. CSIRO is not involved in the underwater search for the missing black box. Any such media enquiries should be forwarded to the JACC media centre JACCmedia@infrastructure.gov.au
News across the world has been dominated by the tragic mystery surrounding the disappearance of Malaysia Airlines flight MH370 somewhere in the southern Indian Ocean.
Many people have been asking CSIRO for our take on the situation, the ocean, the technology being used to find the debris of the plane – so we wanted to let you know how our technology is being used and how we’re assisting the Australian Maritime Safety Authority (AMSA).
Why are we involved in the search?
CSIRO has a Memorandum of Understanding with AMSA that allows them, during a maritime incident, to call on us for scientific knowledge and technical support.
Incidents include oil spills, search and rescue, shipping accidents and in the case of MH370, modelling and projecting the track of debris spotted by satellites.
What are we doing?
To assist AMSA with the search we have created a task force of oceanographers, led by our own Dr David Griffin and Dr Andreas Schiller, to help with two main tasks:
- Back-tracking the items spotted by satellite to a possible common origin (a possible crash site).
- Forward-tracking to guide on-water searches. We are helping to locate items seen by satellites several days ago, to direct boats and planes to where the items could have drifted.
To do this, we’re using a number of ocean models that all run routinely in real-time, as part of our existing ocean monitoring and modelling projects and collaborations. We’re focusing this current capability on the southern Indian Ocean.
How does the modelling work?
Our modelling works in two ways. First, if a piece of debris is located our systems can help to ‘hindcast’, or backtrack, to the original location, or the possible crash site. Secondly, if a piece of debris is located by satellite, our systems can help the boats and planes by forecasting, which helps to locate the debris location one or two days later.
These models use data from the Global Ocean Observing System and Australia’s Integrated Marine Observation System (IMOS*). Three satellites (Jason-2, Cryosat-2 and SARAL) are particularly crucial to the work. The satellites are equipped with altimeters, which map ocean-surface topography, or the hills and valleys of the sea surface, with accuracy better than 5-centimetres. We also use data from several additional satellites which measure the temperature of the surface of the ocean as an additional source of information.
Ocean currents run along the slope of the sea surface like wind flows around high and low pressure systems in the atmosphere.
*IMOS is a national array of observing equipment (satellites, floats, moorings, radars, robotic gliders, etc) that monitor the open oceans and coastal marine environment around Australia. We are one of ten national research institutions and universities that delivers the IMOS ocean portal, allowing anyone to view and download the latest data on our oceans.
How to read ocean models
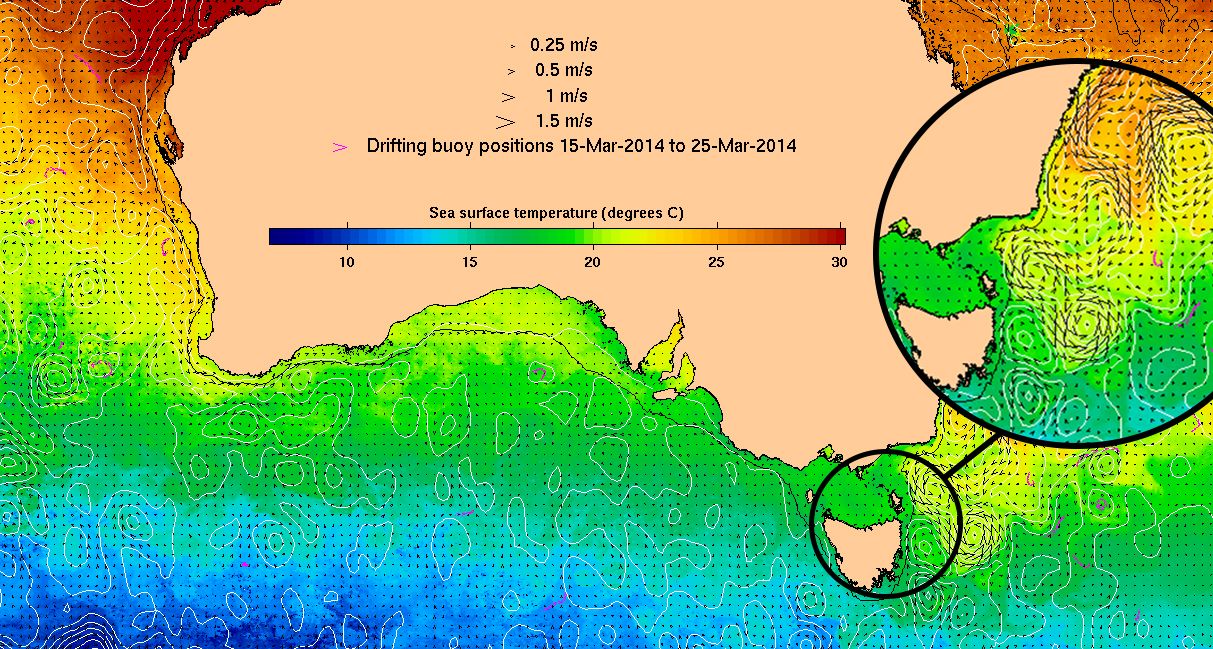
When we create a map of ocean conditions, like the one above displaying conditions on 24 March 2014, we can see the contours (the white lines in the diagram) of the ocean, or the sea level, which helps us to predict where items at the surface, for example debris, are drifting. The black arrow heads show the current direction and strength (bigger arrows mean the water is flowing faster) and eddies (swirling in the ocean) and the different colours shows the sea surface temperature (blue/green being colder, orange/yellow being warmer).
The map above is also giving us information from the Global Drifter Program (a network of satellite-tracked surface drifting buoys); you might be able to see the little magenta arrow heads showing us the buoy location and direction.
For more information on our ocean modelling and forecasting, see BLUElink, a collaboration between CSIRO’s Wealth from Oceans Flagship, the Bureau of Meteorology and the Royal Australian Navy.
The challenge we face
The ocean is vast and conditions are continuously changing. This area is known for strong winds, large waves and turbulent eddies. Debris can potentially travel up to 50 kilometres a day. We are tracking eddies in the Indian Ocean, around the area of the search, which are about 100 kilometres wide. The water is moving around these at about 0.5 metres a second, or one knot.
The modelling and observations are not completely precise but they are a big help, for example, the video below demonstrates how debris would move across the ocean over a period of nine months (data covers March – November 2009).
For media enquiries and more information regarding the search, visit JACC’s website.
For media enquiries regarding CSIRO’s involvement, contact Nick Kachel, 02 4960 6270 or nicholas.kachel@csiro.au.

4th April 2014 at 6:18 pm
Fantastic article and video, I was really interested to see more about our involvement in the search. One little niggle, the video has no units for the x and y axis – is it km’s, meters, lat and long? Its impossible to know how significant the drift actually is without that.
7th April 2014 at 9:21 am
Hi Allison,
Thanks for your feedback! The numbers on the y-axis are latitudes from 24 S to 47 S and those on the x-axis are longitudes from 81 E to 119 E.
Cheers,
Steph
30th March 2014 at 4:40 pm
The web has a number of good examples of ocean modelling which seem to depend on the computing power, the number of tracking points and the variables effecting the current. Given the sensitivity and polarised arguments why is there no high profile (ie public) model evidence around the dredging dump of silt near Barrier Reef?
31st March 2014 at 2:50 pm
Thanks for your comment. While we can’t speak on behalf of the myriad of organisations who may produce ocean models around the Great Barrier Reef, we have a number of long term projects in place that help to monitor the waters of the GBR. The websites for eReef http://www.ereefs.org.au/ and BLUElink http://www.csiro.au/BLUElink allow you to access the research quite readily.
best
Carol
1st April 2014 at 12:49 pm
Grateful for quick response and note sensitivity. I think you guys would have done a great job if asked to model the dredge spoil impact over long lifetimes.
Best
Andy
1st April 2014 at 1:58 pm
Thanks Andy.
28th March 2014 at 11:40 pm
The best option is to look for satellite images captured just around the time when last ping was received. In case of a plunge a big debris pool might have been captured by some imagery. Now debris may have dispersed miles away from the crash site.
28th March 2014 at 11:37 pm
Good Luck, guys -a massive challenge with many unknowns from source locations, windage factors and meso-scale eddies. We’re also busy in the UK over the last few years tracking (forward and backward) tar and wax balls, wood slicks and human bodies (Forensic oceanography)
28th March 2014 at 2:25 pm
Reblogged this on rainunes69.