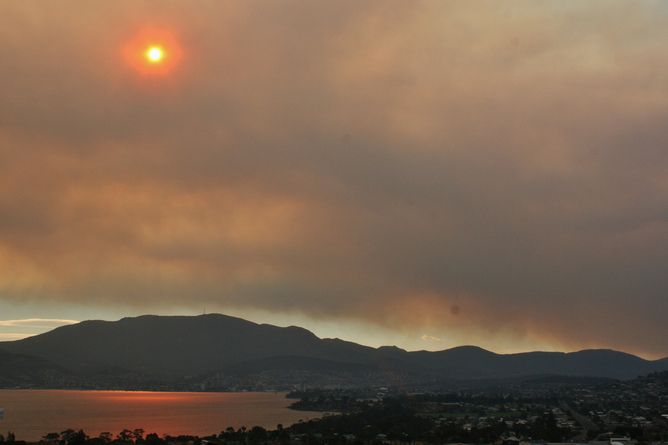
El Niño could stoke more extreme bushfire weather. Image: James975/Flickr
By Wenju Cai, Principal Research Scientist, Wealth from Oceans Flagship
Recently speculation has been rife that the end of 2014 will see an El Niño event — the change in Pacific ocean and atmosphere circulation that is known to produce drought, extreme heat, and fire in Australia. The Bureau of Meteorology’s latest statement predicts that Pacific Ocean temperatures may approach El Niño levels by early winter, but the jury is out beyond the end of this year.
Given the catastrophic effects El Niño can have, should we be getting prepared anyway?
An El Niño for 2014?
A small number of models have predicted an El Niño later in the year. But these models generally suffer from what scientists call an “autumn predictability barrier”. During the southern hemisphere autumn it is hard to distinguish the development of an El Niño from background variability.
But a recent high-profile paper in Proceedings of the National Academy of Sciences adamantly predicted an El Niño later this year, using a new framework that explores how ocean temperatures are connected between the equatorial Pacific and other regions. The paper claims to overcome the autumn predictability barrier, quoting a 70% success rate in simulating prediction of historical El Niño events.
Preparing for the worst
To better ready ourselves for an El Niño event, we need to know what the impact might be. El Niño affects our lives in many ways.
One important consideration is Murray River, which supports economic activities estimated at tens of billions of dollars each year, including our irrigated agriculture and water supply in regional areas.
El Niño can also happen in conjunction with other climate cycles. When an El Niño coincides with the positive phase of the Indian Ocean Dipole, there is usually a dramatic reduction in annual inflow.
A prediction of an El Niño will trigger consideration of water allocation by our water managers, taking into account of the need for environmental flow to ensure the long-term health of the river.
Another consideration is drought, which has a direct impact on our ecosystems and farming communities. Our farmers are very skilled in using El Niño prediction information. They use the information to decide what crops to plant and level of cropping activities. Sometimes it is better not to grow anything, to limit losses.
An incorrect prediction can be costly too. So our farmers make ongoing decisions using updated information (normally on a monthly basis). From time to time they will need help to get through tough times, and so our federal government needs to budget for drought relief.
A further consideration is extreme weather. More heatwaves, bushfires and dust storms will have an impact of human health, infrastructure, and emergency services. For example, our senior citizens are most affected by heat stress.
In the week of the recent January heatwave in Victoria, the number of deaths more than doubled. It’s a common-sense matter of getting well prepared to ensure relief is available when needed. If a cooler is needed, it is too late to install it after you hear the weather forecast.
Global warming: loading the dice
This year, and in summer 2013, southeast Australia experienced significant and unprecedented heatwaves, both associated with bushfires. These kinds of events usually take place in an El Niño year.
In fact, an average El Niño increases the global mean temperature by 0.1C. One example is the extreme El Niño of 1982-83, in which a string of heatwaves preceded the Ash Wednesday bushfires, amid severe drought conditions.
But 2013 and the summer just past were not a result of El Niño. In fact these record-breaking heatwaves occurred at a time when the increase of global surface temperatures has slowed, although regionally temperatures continue to increase. Inland Australia — the source of heat in south east Australian heatwaves — continues to warm.
The reason for the slowdown in the rising global surface temperatures is another ocean and atmosphere cycle: the Pacific Decadal Oscillation (PDO). Currently in a negative phase, the PDO is encouraging heat to be stored in the ocean thanks to changes in trade winds. Likewise, during a positive PDO, less heat is stored in the ocean, which can enhance the effect of El Niño as in the 1982-83 event.
So there are a range of scenarios depending on a number of different climate cycles. Imagine this one: global warming continues unmitigated by a “hiatus”, and then an El Niño or extreme El Niño occurs. Such an alignment of warming, positive PDO and El Niño is likely to occur several times over the next 20 years. While we can’t predict exactly when the PDO might shift to a positive phase, we might expect the current negative phase to last another four to five years.
If we didn’t like what we experienced in 2013 and early 2014, we’re unlikely to enjoy this worst-case scenario. Heatwaves will be not only more frequent, but hotter too. The associated drought would eventually break, but it will be longer and more severe. Are we ready?
This article was originally published on The Conversation. Read the original article.

8th March 2014 at 6:32 pm
Steph and Peter, this is Wes Alderson, a former member of AMS, retired now. To discover the underlying root of why the winds and temps change, we must look outside the art and science of weather. Let’s leep in mind the fact that Astronomical events affect the velocity at which the Earth spins and wobbles in its orbit. as well as varies in the angle it presents to the sun-the primary heat source. Now and then, the rotation of the solid earth slows down just a tiny bit, due to outside influences – say the moon’s orbit aligned with the sun. When that happens, the kinetic energy that existed a minute ago, must be transfered and expressed in some other manner. If we dump X amount of spin of solid Earth, we must competsante by picking up X amount of ocean or air force in the same vector. From such changes, all sorts of downwind changes occur. One, for example, is Steph is correct. If we have a ocean current moving away from a coast line, the colder waters down at, say a mile depth swril up to the surface, presenting a much more stable lower atmospher and cooling downstream. Vice versa and on an on we go. Weather is just as much a “feel” and “art” as it is a science.
7th March 2014 at 4:57 pm
Steph,
I assume the perturbation you mention is the drop in the prevailing wind.
So how does the “perturbation” arise? That perturbation is unexplained, and until it is, there is no explanation – as I said before.
The situation is :-
The usual prevailing wind increases the temperature in the west Pacific – as noticed.
This causes a bigger temperature difference between West and East.
This, in turn, should INCREASE the prevailing wing.
This makes the current theory’s “the wind drops because of El Nino” a less than successful – circular – explanation of El Nino. It’s essentially saying El Nino causes El Nino!
Your statement
“The trade winds put the heat in the west Pacific ocean, while bring cold water to the surface, both cooling the globe.”
does seem odd. A wind that cools the globe! The heat has got to come from somewhere – and go somewhere. The heats have to balance.
7th March 2014 at 5:52 pm
The system is full of weather noises that can be a perturbation.
El Nino leads to a La Nina, which creates a condition for El Nino again.
7th March 2014 at 6:43 pm
So. El Nino/ La Nina is weather noise!
In that case, why is Dr Wenju Cai trying to model it?
6th March 2014 at 3:34 pm
Why is it that
” .. an average El Niño increases the global mean temperature by 0.1C.” ?
6th March 2014 at 4:30 pm
Hi Peter,
During an El Nino event the heat that’s stored by winds in the tropical Pacific is released to the atmosphere, making the global mean surface temperature warmer. This doesn’t mean that everywhere in the world will be warmer by 0.1 C (this is just a global average). Some regions will get a cooling, like the western Pacific.
During a La Nina event, surface heat is stored in the ocean by the winds and the global surface temperature tends to be lower. This stored heat will then be released again in the ensuing El Nino – and the cycle repeats.
The above figure was obtained by averaging global mean surface temperatures during El Nino years and comparing it with that for neutral years (not El Nino or La Nina years).
Cheers,
Steph
7th March 2014 at 10:45 am
Thanks Steph.
I’m not sure that I understand what you’ve written.
1. However, what starts or stops these winds? Without that explanation, there is no explanation.
2. A large area of the tropical eastern Pacific suddenly becomes as much as 5C warmer than usual. That’s hard to understand, using the currently accepted El Nino theory/explanation, because winds across an ocean surface would be expected to produce cooling.
7th March 2014 at 1:49 pm
Peter, the wind anomalies are themselves part of the El Nino cycle. The key to understanding this is a positive feedback in the Pacific.
The cold water in the eastern Pacific is because of the trade winds blowing from the east to the west, which bring the subsurface cold water to surface. The cold water in the east in turn enhances the west-minus-east temperature gradient, maintaining/enhancing the trade winds, and the cold water in the east. The trade winds put the heat in the west Pacific ocean, while bring cold water to the surface, both cooling the globe.
During El Nino, a perturbation leads to a reverse of the above process; weakening trades lead to a warming in the east; the change in temperature gradient in turn weakens the trade further (even reverses the trades), and the warming grows.
Hope that helps!