
A combination of coastal tide-gauge and satellite-altimeter data shows sea levels have been rising since the late 1800s.
The World Meteorological Organization reports that 2014 is on track to be possibly the world’s hottest year on record. Meanwhile, there’s been a lot of public commentary lately about the so-called “hiatus” in global surface temperature over the past 18 years, recent sea-level rise, and what it all means.
So what do CSIRO’s research and observations tell us?
They show that average surface air temperatures have continued to rise during the past two decades, but not as fast as in preceding decades. In other words, while the rate of temperature increase is lower, the temperatures themselves are not lower.
It is also important to note that when climate scientists use the term “global-mean surface temperature” they refer to near-surface air temperatures. Surface air temperature is an incomplete measure of warming of the planet; oceans store huge amounts of heat, with about 93 per cent of the extra heat stored by the Earth over the past 50 years being found in the oceans.
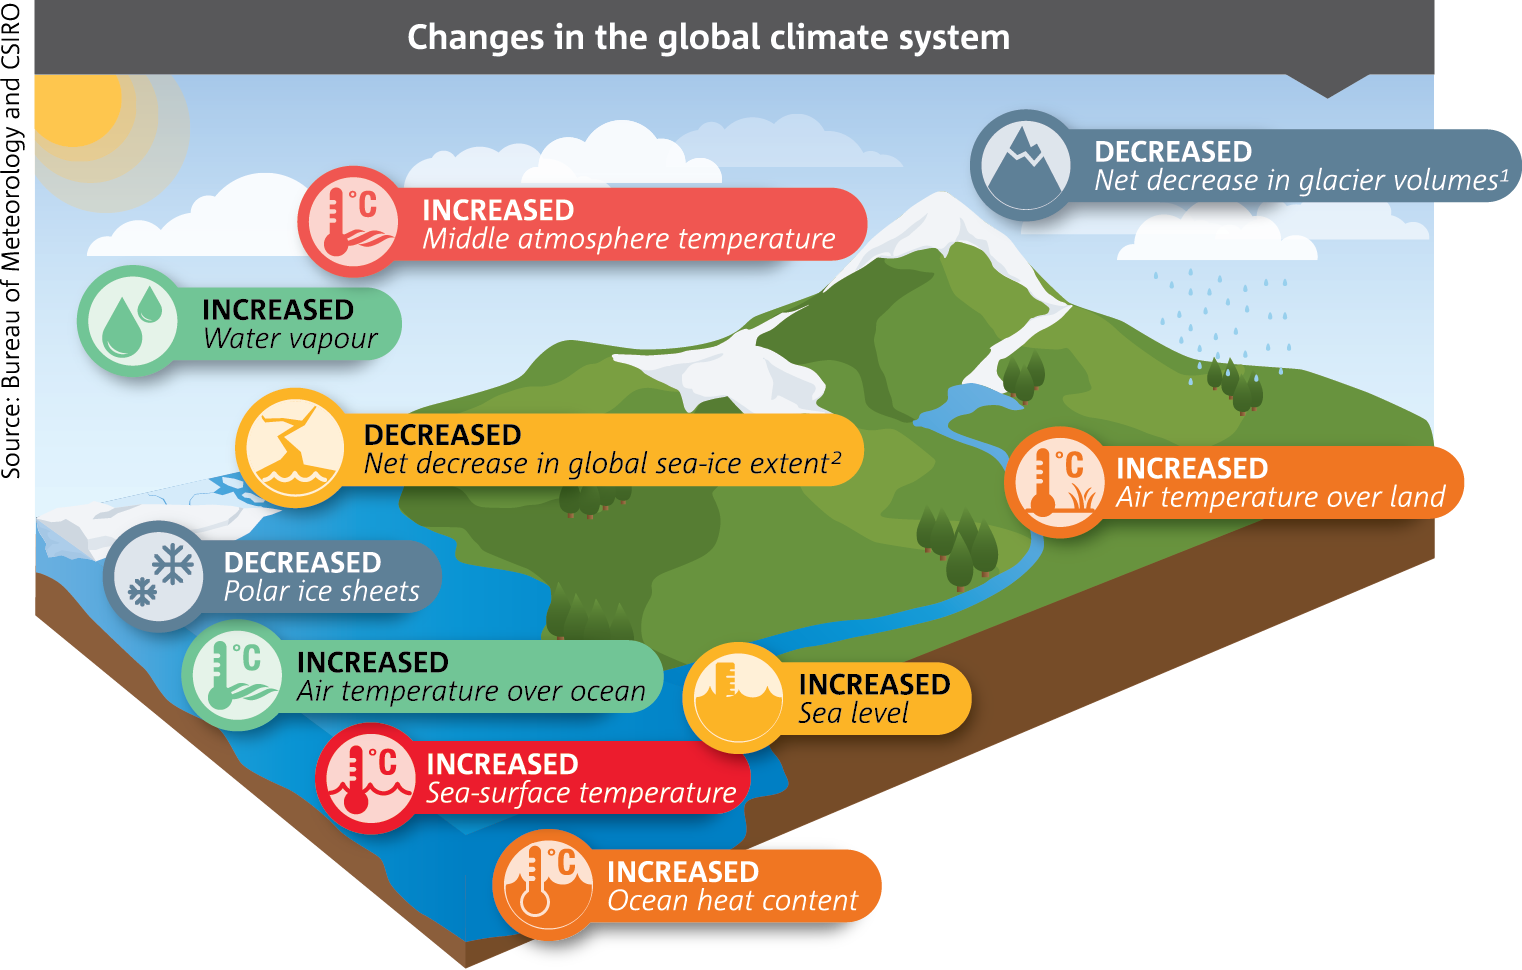
Changes in the global climate system indicating a world experiencing a consistent pattern of warming.*
The ocean today is warmer, and sea levels higher, than at any time since the instrumental record began. As the oceans warm, they expand and sea levels rise. Using a combination of coastal tide-gauge and satellite-altimeter data, CSIRO and others have shown that, globally, sea level has been rising since the late 1800s. Global-averaged sea level rose at an average rate of about 1.6 mm per year over the 20th Century, but this rate has accelerated to about 3 mm per year as measured by satellite altimetry and tide gauges since 1993. So the rate of sea-level rise has not slowed; it has increased.
Our measurements across the land, atmosphere and oceans show that warming has continued unabated throughout the past 18 years.
Last year was Australia’s warmest year on record, followed by 2005 and 2009. For global land and ocean temperatures, 2013 tied with 2003 as the fourth warmest year globally; and 13 of the 14 warmest years ever measured occurred in the 21st Century. As reported by the World Meteorological Organization, this year is shaping up to be the world’s warmest year – the year to the end of October is the planet’s warmest on record.
It is not unusual to see changes in the rate of surface warming. Over the past 120 years, there have been decades where global-mean air temperature has warmed more rapidly, and decades where relative cooling has occurred.
Increases in greenhouse gases provide a warming effect but, due to natural variability, climate trends based on short records are very sensitive to the beginning and end dates, and do not reflect long-term climate trends.
The rate of warming in any shorter period fluctuates because of factors such as short-term natural variability, ocean absorption of heat from the atmosphere, volcanic eruptions, changes in the 11-year solar cycle, and so on. This does not change any conclusion about the long-term trend of warming due to human activities, which have increased the concentration of greenhouse gases in the atmosphere.
CSIRO research has shown that there is less than 1 chance in 100,000 that global mean air temperature over the past 60 years would have been as high without human-caused greenhouse gas emissions. That is, the probability of global temperature increases being due to human activity exceeds 99 per cent.
The world is not cooling.
—
*Note (1) net increase in glacier volumes have regional variation (almost all glaciers worldwide losing mass but some gaining) but overall net loss; and (2) net decrease in global sea-ice extent has regional variation (over the period 1979–2012 it is very likely that the annual mean Arctic sea-ice extent decreased 3.5 to 4.1% per decade, and it is very likely that the annual mean Antarctic sea ice extent increased by 1.2 to 1.8% per decade) but overall net loss. Source: CSIRO and Bureau of Meteorology.
This article was originally published in The Canberra Times.

8th June 2015 at 8:01 pm
I appreciate your work that makes this blog so knowledgeable in getting the disadvantages of the global Warming.
The main cause of the Global warming is excess temperature on the earth.
Record Heat