Every two years CSIRO and the Bureau of Meteorology get together, crunch the numbers and release a definitive report on long term trends in Australia’s climate – The State of the Climate.
The SoC 2014 released today is focused on the changes that have been observed in Australia’s long-term climate trends and it shows that temperatures across Australia were, on average, almost 1°C warmer than they were a century ago, with most of the warming having occurred since 1950.
“Australia’s mean temperature has warmed by 0.9°C since 1910,” BoM chief Dr Vertessy said. “Seven of the ten warmest years on record in Australia have occurred since 1998. When we compare the past 15 years to the period 1951 to 1980, we find that the frequency of very warm months has increased five-fold and the frequency of very cool months has decreased by around a third.
“The duration, frequency and intensity of heatwaves have increased across large parts of Australia since 1950. Extreme fire weather risk has increased, and the fire season has lengthened across large parts of Australia since the 1970s.
“We have also seen a general trend of declining autumn and winter rainfall, particularly in southwestern and southeastern Australia, while heavy rainfall events are projected to increase. Australian average annual rainfall has increased slightly, largely due to increases in spring and summer rainfall, most markedly in northwestern Australia.”
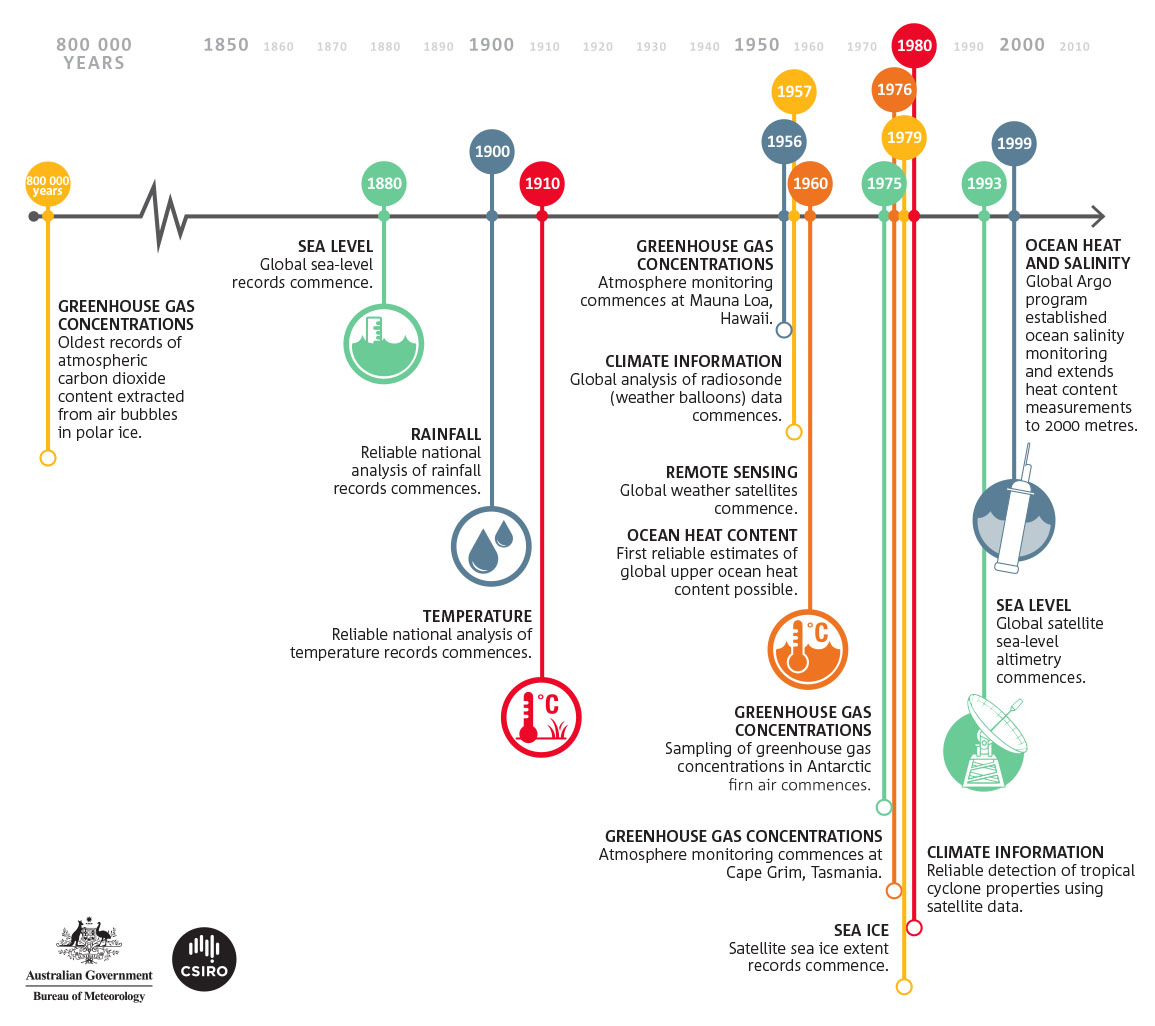
History of data collection
State of the Climate 2014 draws on an extensive record of observations and analysis from CSIRO, the Bureau of Meteorology, and other sources.
CSIRO boss Megan Clark said Australia has warmed in every State and Territory and in every season.
“Australia has one of the most variable climates in the world. Against this backdrop, across the decades, we’re continuing to see increasing temperatures, warmer oceans, changes to when and where rain falls and higher sea levels,” Dr Clark said. “The sea-surface temperatures have warmed by 0.9°C since 1900 and greenhouse gas concentrations continue to rise.”
CSIRO and the Bureau of Meteorology play a key role in monitoring, measuring and reporting on weather and climate, contributing to improved understanding of our changing global climate system. State of the Climate 2014 is the third report in a series and follows earlier reports in 2010 and 2012.
Below are some of the main facts from the report.
Temperature
- Australia’s mean surface air temperature has warmed by 0.9°C since 1910.
- Seven of the ten warmest years on record have occurred since 1998.
- Over the past 15 years, the frequency of very warm months has increased five-fold and the frequency of very cool months has declined by around a third, compared to 1951–1980.
- Sea-surface temperatures in the Australian region have warmed by 0.9°C since 1900.
Rainfall
- Rainfall averaged across Australia has slightly increased since 1900, with a large increase in northwest Australia since 1970.
- A declining trend in winter rainfall persists in southwest Australia.
- Autumn and early winter rainfall has mostly been below average in the southeast since 1990.
Heatwaves and fire weather
- The duration, frequency and intensity of heatwaves have increased across large parts of Australia since 1950.
- There has been an increase in extreme fire weather, and a longer fire season, across large parts of Australia since the 1970s.
Global atmosphere and cryosphere
- A wide range of observations show that the global climate system continues to warm.
- It is extremely likely that the dominant cause of recent warming is human-induced greenhouse gas emissions and not natural climate variability.
- Ice-mass loss from the Antarctic and Greenland ice sheets has accelerated over the past two decades.
- Arctic summer minimum sea ice extent has declined by between 9.4 and 13.6 per cent per decade since 1979, a rate that is likely unprecedented in at least the past 1,450 years.
- Antarctic sea-ice extent has slightly increased by between 1.2 per cent and 1.8 per cent per decade since 1979.
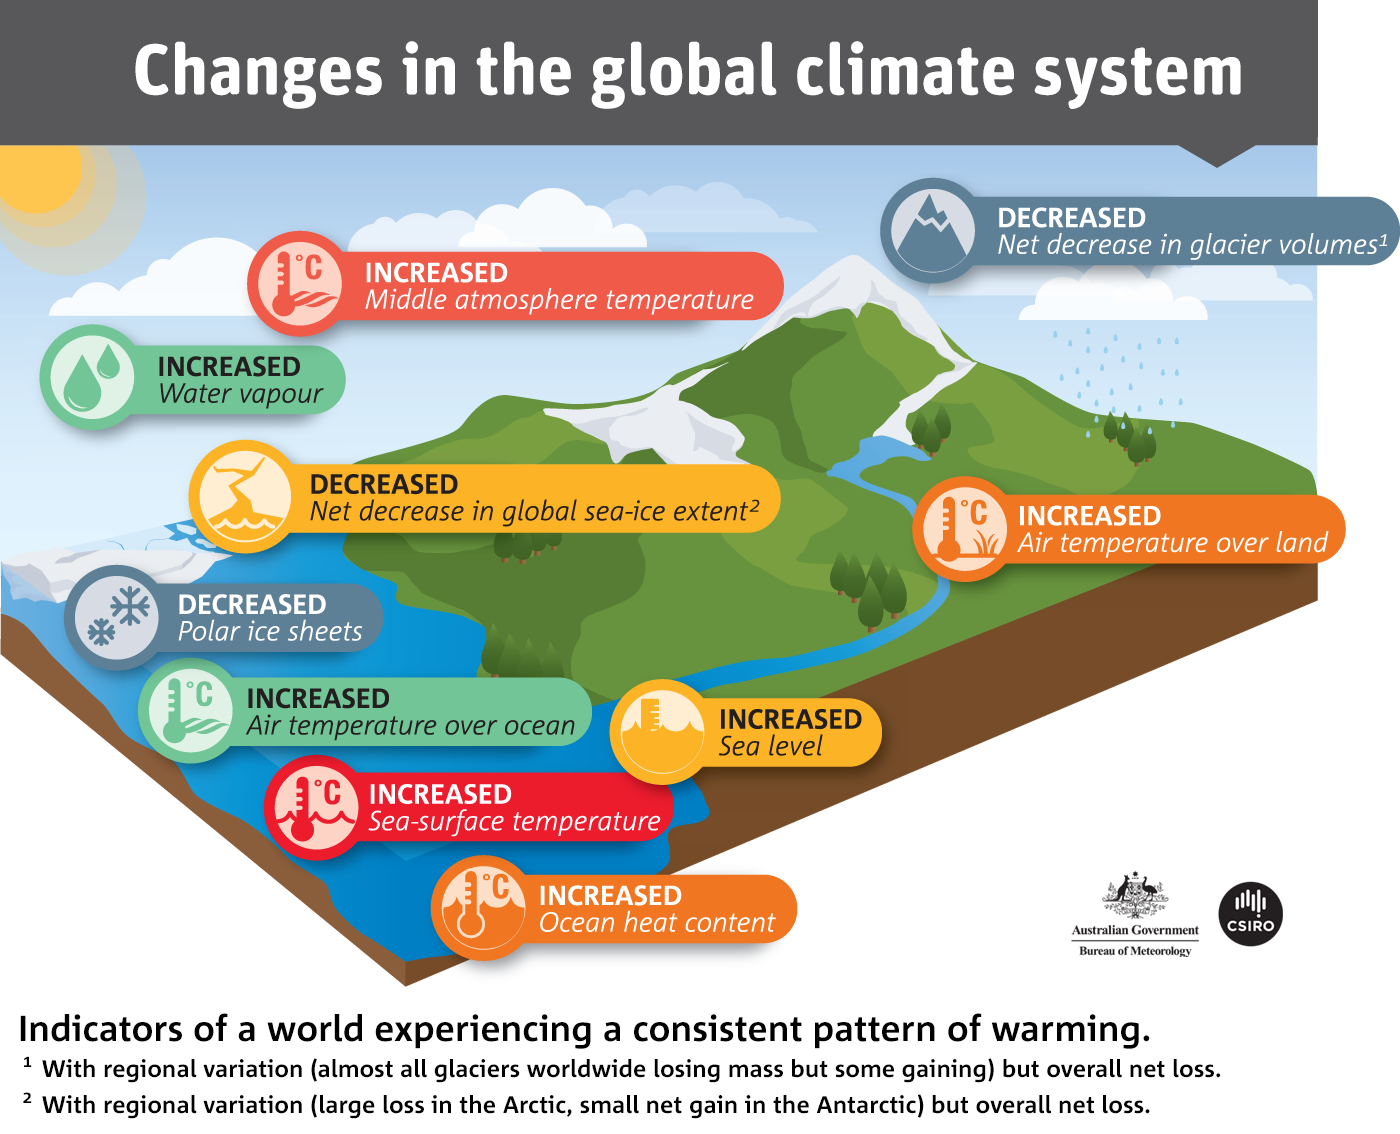 Indicators of a world experiencing a consistent pattern of warming.Oceans
- The Earth is gaining heat, most of which is going into the oceans.
- Global mean sea level increased throughout the 20th century and in 2012 was 225 mm higher than in 1880.
- Rates of sea-level rise vary around the Australian region, with higher sea-level rise observed in the north and rates similar to the global average observed in the south and east.
- Ocean acidity levels have increased since the 1800s due to increased CO2 absorption from the atmosphere.
Greenhouse gases
- Atmospheric greenhouse gas concentrations continue to increase due to emissions from human activities, with global mean CO2 levels reaching 395 ppm in 2013.
- Global CO2 emissions from the use of fossil fuel increased in 2013 by 2.1 per cent compared to 3.1 per cent per year since 2000.
- The increase in atmospheric CO2 concentrations from 2011 to 2013 is the largest two-year increase ever observed.
Future climate scenarios for Australia
- Australian temperatures are projected to continue to increase, with more hot days and fewer cool days.
- A further increase in the number of extreme fire-weather days is expected in southern and eastern Australia, with a longer fire season in these regions.
- Average rainfall in southern Australia is projected to decrease, with a likely increase in drought frequency and severity.
- The frequency and intensity of extreme daily rainfall is projected to increase.
- Tropical cyclones are projected to decrease in number but increase in intensity.
- Projected sea-level rise will increase the frequency of extreme sea-level events.
Download the full report on our website. Follow the conversation on Twitter with #SoCAus
***
Media: Huw Morgan M: +61 417 834 547

6th March 2014 at 6:15 pm
Thanks from Neil Cameron, Meredith Vic mg.house@bigpond.com
see a laymans’s ‘take’ on my embryic blog http://www.theabcofglobalwarming.com.au, that human activity MUST be warming the globe.
ps for the deniers: I am a self-employed farmer, and agricultural scientist from way, way back!
6th March 2014 at 3:22 pm
The 06Mar14 newsletter notes that Australia’s temperature has risen over the past century. That’s been measured. But how do we know it’s due to carbon dioxide increase? That it’s not natural?
I know carbon dioxide is a greenhouse gas, but I believe that effect diminishes with increasing concentration, in line with the (negative exponential) Beer-Lambert Law. So how much temperature increase can be shown due to carbon dioxide’s greenhouse effect, and what will its effect be in future? Surely this has been measured.
6th March 2014 at 3:45 pm
Hi Peter,
Multiple lines of evidence suggest it’s extremely likely that the dominant cause of recent warming is human-induced by greenhouse gas emissions and not natural climate variability. The IPCC has an assessment and summary of related studies if you’re interested: http://www.ipcc.ch/
In terms of CO2 saturation, this webpage should answer your question: http://www.skepticalscience.com/empirical-evidence-for-co2-enhanced-greenhouse-effect.htm
Cheers,
Steph
6th March 2014 at 8:01 pm
Hi Peter,
The energy absorption of CO2 is measured directly via satellite by NASA and other agencies. The first of these Earth Radiation Budget Satellites was launched in 1984, they measure total energy input to the earth by having sensors aimed at the sun and a suite of sensors scanning the earth at different wavelengths.
Currently more energy is going in than coming out and the shortfall happens in the CO2 absorption band proving it’s CO2. Moreover this technique is more accurate than conventional thermometers which are only proxy measurements of the expansion of a fluid in a narrow tube whereas spectrum analysis measures exact temperature via frequency (E=hv) and photon count… Much more reliable than variously placed thermometers.
http://science.larc.nasa.gov/erbe/
The extra energy trapped by the increase in CO2 is equivalent to detonating 400,000 Hiroshima sized atom bombs per day, so it’s not easily missed.
Here’s a short video by Dr Richard Alley, an ice core and climate specialist. Here he shows the actual spectrum of absorption detected by ERBS, he also shows how much the absorption has increased since 1984 and how much more absorption can happen before saturation is reached.
http://m.youtube.com/watch?v=uHhLcoPT9KM
It was the US Air Force that did the detailed work in atmospheric physics when they were developing heat seeking missiles. Heat Detectors need to do the opposite of ERBS, they need to stay away from CO2 absorption wavelengths.
http://m.youtube.com/watch?v=JoR4ezwKh5E
Cheers.
4th March 2014 at 11:57 am
Thanks again for the good unbiased work.
4th March 2014 at 11:55 am
Thank you.
4th March 2014 at 7:30 am
All this evidence, all this frightening evidence, yet we continue to sleepwalk towards a completely unkown but very likely catastrophic future of our own making. As the song said, “When will they ever learn, when will they ever learn?”