By Ken Taylor, Research Scientist, CSIRO ICT Centre
If you’ve ever watched a professional bike race such as the Tour de France on TV, you might have thought to yourself: “Just how good are the professionals?” And if you do a bit of cycling yourself, you might be inclined to wonder: “How much better are they than me?”
Using data from the 2013 Tour Down Under – held in late January in and around Adelaide – I was able to compare the efforts of amateur recreational cyclists against those of professionals in the race.
On Stage 4 of the Tour Down Under more than 6,500 recreational cyclists took part in the Bupa Challenge Tour, riding along the same route as the professionals just a few hours before the race.
Of the 6,500 cyclists that took part in the recreational event, 950 recorded their ride using the popular “social fitness” website Strava. I was then able to analyse this wealth of shared data to compare the efforts of amateur cyclists with the efforts of professional rider Serge Pauwels from the Omega Pharma-Quickstep team.
While German sprinter Andre Greipel won that Tour Down Under stage at the head of the peloton, Pauwels finished 42nd as part of the same group. This meant that Pauwels’s time was considered equal to that of Greipel’s.
As Pauwels remained in the peloton all day, riding conservatively, his effort represents the minimum needed to ride with the pros on a fast stage that averaged 41.5km/h.
So how did the non-pro riders perform over the same course?
While there could be a difference in the effort put in by pros and amateurs – for a start, the pros were racing and the public were not – many riders seem to have been giving it their best, particularly the faster amateurs.
As Kalvin Bartlett, the 10th fastest amateur rider on the day (from those on Strava) said: “… some people need to distinguish between a charity ride and a race”.
The amateur riders also had to be motivated enough to turn up and choose the full 127km of Stage 4 rather than one of the shorter alternatives available on the day. This would suggest that the riders in question are all reasonably strong.
(If you didn’t ride in the Bupa Challenge you can get a rough idea of how you would have gone by comparing your average speed over a long ride to that of the amateur field below. You’d have to be able to average a punishing 26km/h including rest stops to make the top half of the amateur field in the Bupa Challenge Tour.)
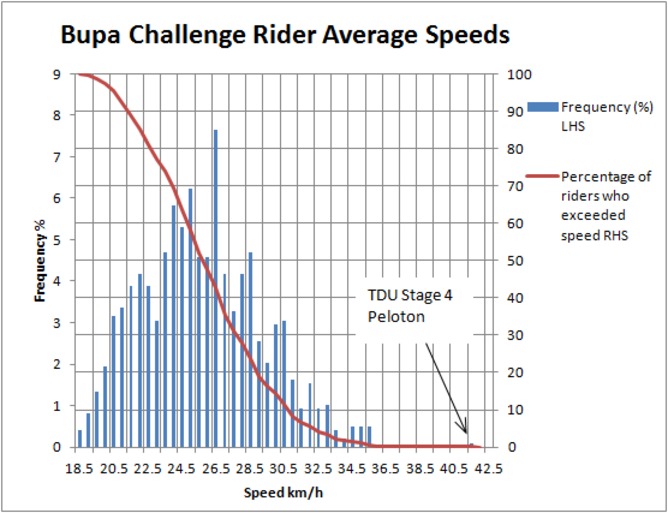
The image above shows that Pauwels and the rest of the riders in the pro peloton were 4.4 standard deviations faster than the mean of everyone else and a full 5.7km/h faster than the quickest amateur.
How did they do it?
Well the obvious answer would be “they pedalled harder” but as it turns out, for the best of the amateurs, this isn’t the case.
A cyclist generates power to propel the bike forward, and this is measured by multiplying the force they exert on the pedals by how fast the pedals are rotating. Power is lost to air drag, rolling resistance and fighting gravity as they climb hills.
The heavier the cyclist, the higher the power they should be able to produce. As such, Serge Pauwels’s weight of 64kg makes his average of 223W more impressive than if he’d been, say, 80kg.
A cyclist can produce high power for short intervals but this will leave them tired. Each cyclist has a maximum amount of power they can produce over any particular interval. These best efforts can be shown in a curve compiled from their highest power over multiple efforts.
The image below compares Pauwels’s previously established best-effort power curve (dashed blue line) against his power curve for stage 4 (dashed red line) and the power curves of the four fastest amateurs (as per Strava) that had power meters during the Bupa Challenge Tour.
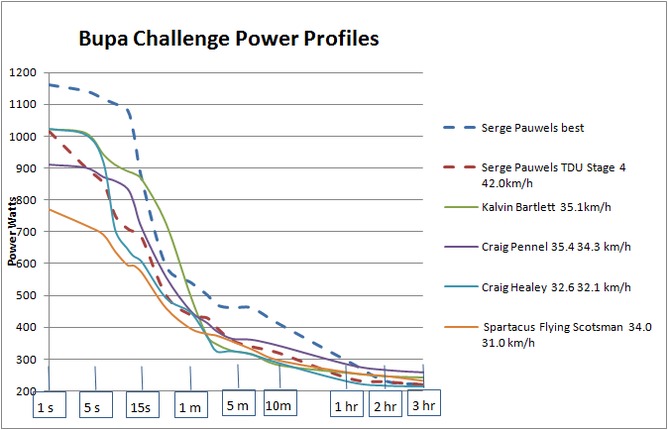
Despite going much faster Serge Pauwels produced less power than some other riders. Rider speeds are speed while moving and speed including rest stops. Ken Taylor
This image shows that Pauwels rode at his long-distance best but fairly conservatively – that is, he was well below his best over shorter intervals.
This conservative riding would have helped Pauwels stay fresh enough to achieve strong results in later stages of the six-stage tour. In turn, these strong results allowed him to finish the Tour Down Under in 20th place overall.
Three of the amateurs produced a higher average power than Pauwels, including one who recorded 243W – nearly 10% more than Pauwels’s 223W.
And one of the amateurs, “Spartacus Flying Scotsman”, was able to ride more conservatively (i.e producing less power in short intervals – see figure 3 above) while producing more power overall.
But Pauwels was more efficient, riding at a higher average speed from a lower average power than all of the amateurs.
Just how efficiently Pauwels rode can be seen by plotting speed against power, for all riders who uploaded power meter data to Strava (as seen in figure 4 below). Only 28 of the 950 riders used power meters and of these four were identified as unreliable and excluded.
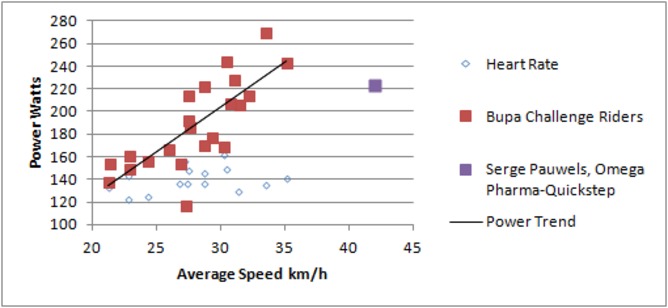
Power vs speed for the 2013 Bupa Challenge, Tour Down Under Stage 4. Unexpectedly, the relationship is approximately linear for all but the pros despite air drag being proportional to velocity cubed. Ken Taylor
The power required to overcome air drag is proportional to a rider’s velocity cubed (i.e. the drag increases dramatically the faster you go). And yet the power vs speed relationship for the amateurs is approximately linear.
This is unexpected, but because Pauwels is well below the trend, it emphasises just how efficiently he rode.
So, to keep up with the pros, the average Bupa Challenge rider needs to produce an additional 50W – an increase of a little more than a third – and ride much more efficiently to increase their speed by more than 50%.
And for the rest of us, matching the pros is an even more difficult task – most probably couldn’t ride 127km at any speed.
Ken Taylor has previously conducted cycling research funded through a CSIRO and AIS partnership. See https://www.csiro.au/en/Organisation-Structure/Divisions/Materials-Science–Engineering/CSIRO-and-AIS.aspx .
He works for CSIRO.
![]()
This article was originally published at The Conversation.
Read the original article.

8th February 2013 at 4:23 am
Isn’t there a significant piece that is missing from this article, specifically the impact of the Peloton itself?
Do we know how large was the group that our top 10 amateur was riding in?
How did this group size compare to the size of the Peloton our Pro was riding in?
Was our pro much more shielded from the wind by his compatriots than was the Amateur?
If comparing a stand-alone Pro versus a stand-alone Amateur in a Time Trial, then much of the above discourse would ring true to me regarding how much the Amateur would need to improve to match the pro.
Factoring peloton versus non-peloton, I believe, and could clearly be wrong, is a variable that is too big to ignore and would significantly impact the Amateur’s actual increased power requirement, which I believe would be much less.
7th February 2013 at 10:35 am
Reblogged this on PedalWorks.